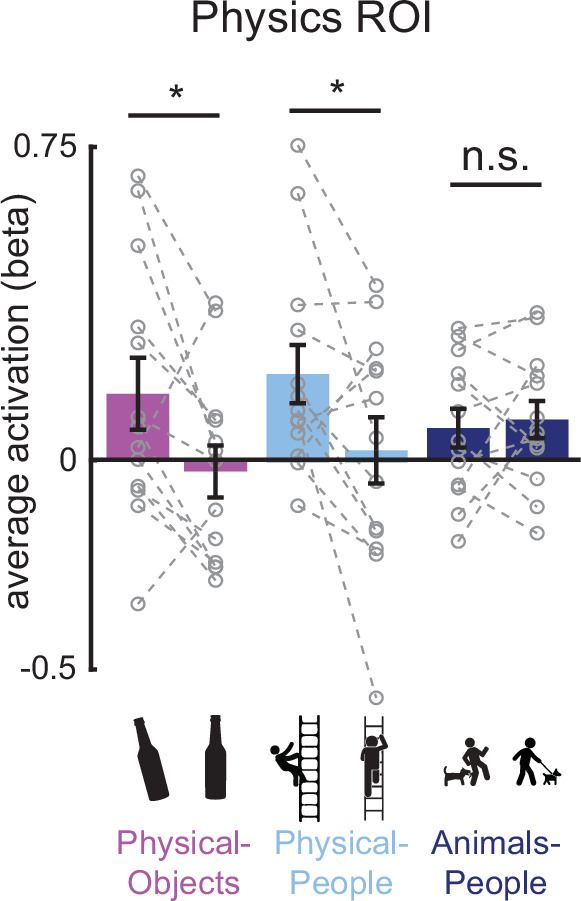
Figure 4. Bar plot showing the average activation (GLM beta estimates) in the physics functional regions of interest (fROI) for both stable and unstable conditions in each of the three scenario types (Physical-Objects, Physical-People, and Animals-People).

Gray circles and the corresponding connecting lines indicate individual subject’s data. Error bars indicate standard error of mean across subjects. * indicates significant effect at p < 0.05 and n.s. indicates no statistically significant effect.
