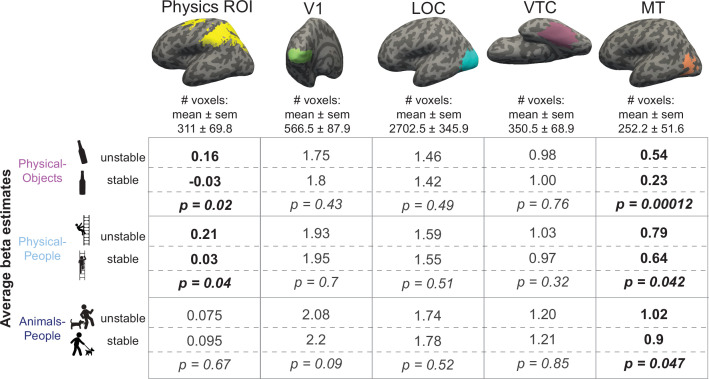
Figure 5. Average beta values for unstable and stable conditions in each of the scenarios.
Columns represent different functional regions of interest (fROIs). Each cell shows average GLM estimated beta values for unstable and stable conditions along with the p value for a paired t-test comparing the two sets of values. Scenarios showing significantly higher response to unstable scenes compared to stable scenes are highlighted in bold in each column.

