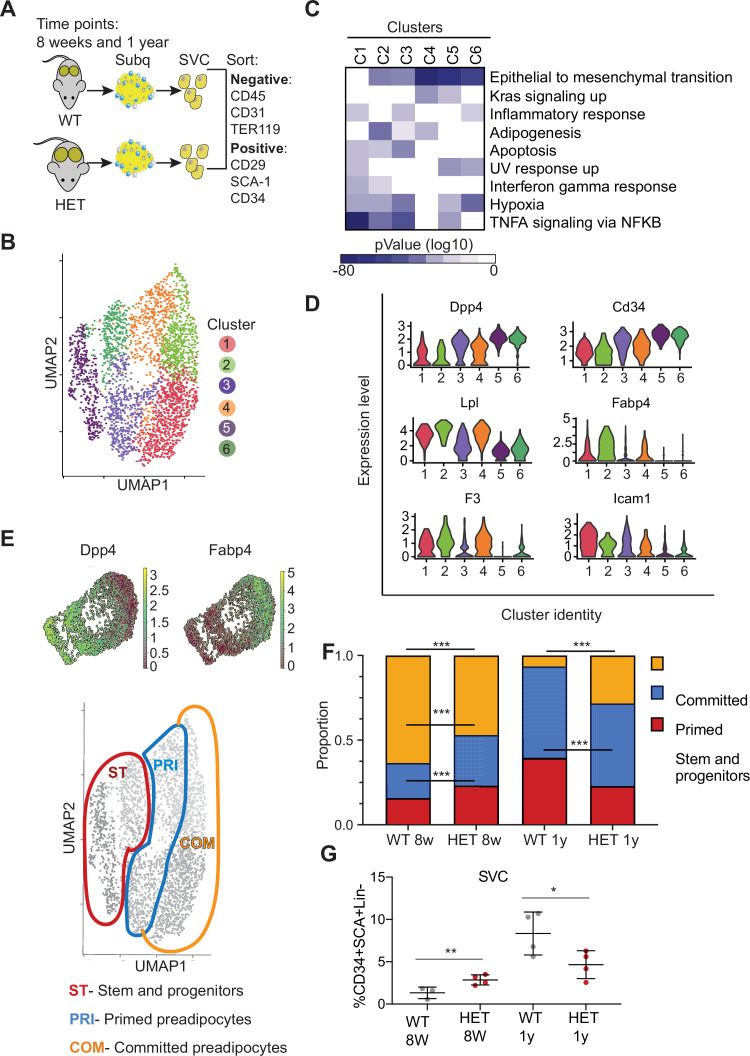
Figure 3. Dnmt3a-HET adipose tissue contains more stem cell-like preadipocytes at the expense of committed preadipocytes.
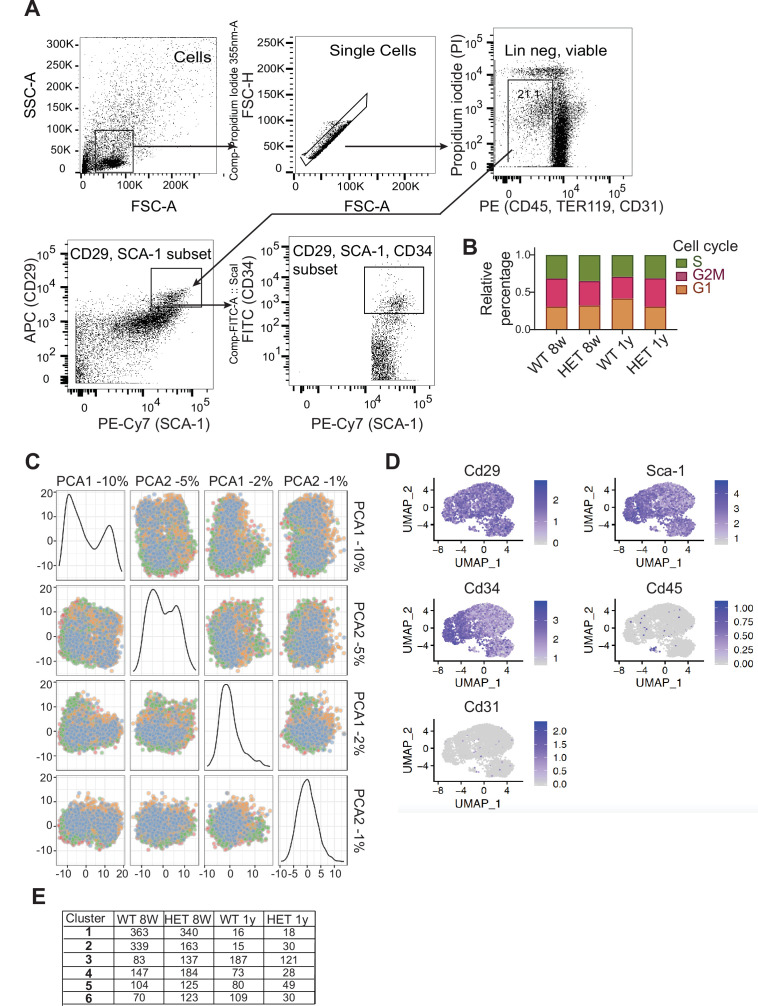
(A) Scheme of single cell RNA sequencing from stromal vascular cells (SVC) of WT and 3A-HET adipose tissue. (B) Uniform Manifold Approximation and projection (UMAP) clustering of pooled preadipocyte cells from WT and 3A-HET at 8 weeks and at 1 year of age. (C) Top hallmark pathways of marker genes for each cluster shown as a heat map. Marker genes were enriched in a cluster compared to all other clusters. (D) Expression levels of cluster-defining marker genes depicted by violin plots. The y-axis marks the normalized log-scale of average read counts. (E) Top: UMAP representation of the stem cell marker Dpp4 and the committed preadipocyte marker Fabp4 across all clusters. Bottom: definition of cellular states for the clusters based on the levels of Dpp4 and Fabp4. Stem and progenitor cells had the highest Dpp4 with no Fabp4. Primed preadipocytes expressed both Dpp4 and Fabp4, and committed preadipocytes expressed mainly Fabp4. (F) Quantification of the denoted cluster proportions at 8 weeks (8 w) and 1 year (1y). *p<0.05, **p<0.01, ***p<0.001 by Fisher exact test. (G) Quantification of preadipocytes in stromal vascular cells (SVC) cells by flow cytometry using the following strategy: cells were selected as lineage negative (lacking Cd45, Cd31, and Ter119) and positively expressing Cd34, Sca1, and Cd29 cell in WT and 3A-HET stromal vascular cells (SVCs) at 8 weeks and at 1 year of age. *p<0.05, **p<0.01 by Student’s- t- test.


