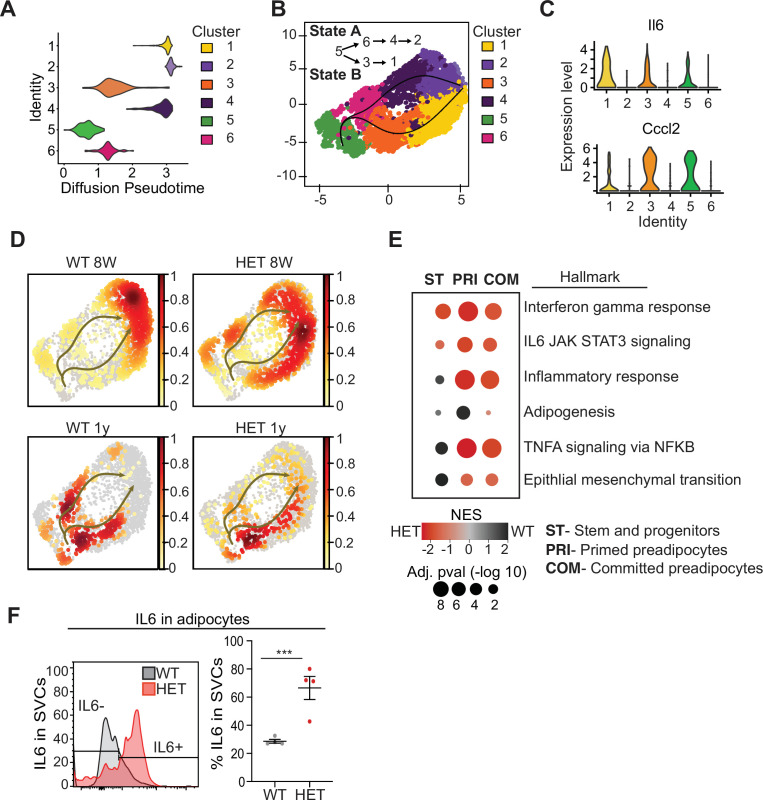
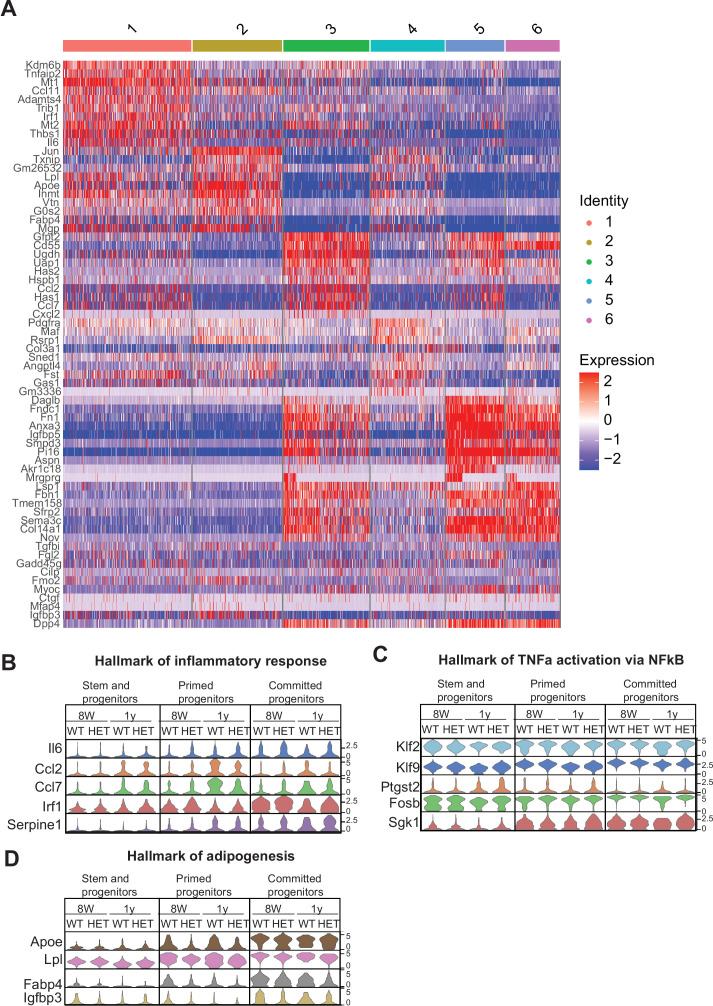
Figure 4. Pseudotime diffusion analysis shows that loss of Dnmt3a leads to increase in pro-inflammatory cellular trajectory.
(A) For each of the clusters as identified in 8-week-old WT mice preadipocytes we calculated diffusion score. The lowest diffusion value indicates that cells within the cluster display a more naïve stem-like gene expression profile. (B) Cell trajectories inferred by slingshot analysis overlaid on UMAP data (curved lines). (C) Expression levels of inflammatory marker genes that define clusters 1, 3 and 5, as depicted by violin plots. The y-axis marks the normalized log-scale of average read counts. (D) UMAP representation of the identified cell sates from B for cells from 8-week and 1-year-old mice. (E) Gene enrichment analysis (MsigDB) based on differential gene expression as calculated from the single cell RNA seq data. For each of the specified groups we ranked genes by average log2 fold change within state A or B and separated by genotype. Color indicates relative contribution of WT (blue) or HET (red) cells. Size of circle denotes bonferroni log transformed 10 adjusted p-value. (F) IL6 protein levels in permeabilizated SVCs that lack CD45 marker by flow cytometry. Left: representative quantification of Il6-positive cells. Bottom: quantification of Il6 positive cells as percentage of CD45-negative cells in adipocytes from 1-year-old mice.


