. 2022 May 30;11:e72359. doi: 10.7554/eLife.72359

Figure 5. DNMT3A regulates preadipocyte proliferation and differentiation.

(A) Western blot probed with DNMT3A antibody after CRISPR KO in BAC-C4. Three clones of each are shown. (B) Proliferation of three WT and KO clones of BAC-C4 cells; assay based on water-soluble tetrazolium (MTT). (C) Representative staining of lipid droplets (LipidTOX (green)) following 6 days of differentiation of BAC-C4 control and KO cells. Scale 2 mm. (D) Incorporation of fluorescent fatty acid (BODIPY FL C12 (green)) relative to red nuclear fluorescent staining quantified during live cell imaging at day 5 of differentiation. Statistical analysis two-way ANOVA. *** p<0.0001 (E) Quantification of green, fluorescent fatty acid in control and KO cells following treatment with isoproterenol. Data shown is relative to the abundance of green fluorescence at baseline. Statistical analysis two-way ANOVA. *** p<0.0001 (F) Representative immunostaining of cells with the indicated antibodies. Cells were differentiated for 5 days and then treated with isoproterenol for 24 hr (G) RNAseq analysis at baseline (average of three clones from each genotype, non-treated, NT), at day 6 of differentiation (DIFF, two clones each genotype), and following 24 hr treatment of cells after 5 days of differentiation with isoproterenol (ISO, two clones each). Left panel: For genes defined as upregulated in BAC-control compared to KO following ISO, we plotted log transformed mean expression for all conditions. Right panel: Heatmap of MsigDB enrichment of genes upregulated in BAC-control (fold >2, p ≤ 0.05) compared to BAC-KO (Fold >2, p ≤ 0.005). (H) Using RNAseq data from (E): Left panel: log transformed mean expression for all conditions for genes defined as upregulated in BAC- KO compared to control following ISO. Right panel: Heatmap of MsigDB enrichment of genes upregulated in BAC-KO (fold >2, p ≤ 0.05) compared to BAC-Control (Fold >2, p ≤ 0.005). (I) Heatmap of top 5 genes differentially expressed between control and KO and annotated to the hallmarks adipogenesis or Epithelial to mesenchymal transition (EMT) and TNFa signaling pathways.

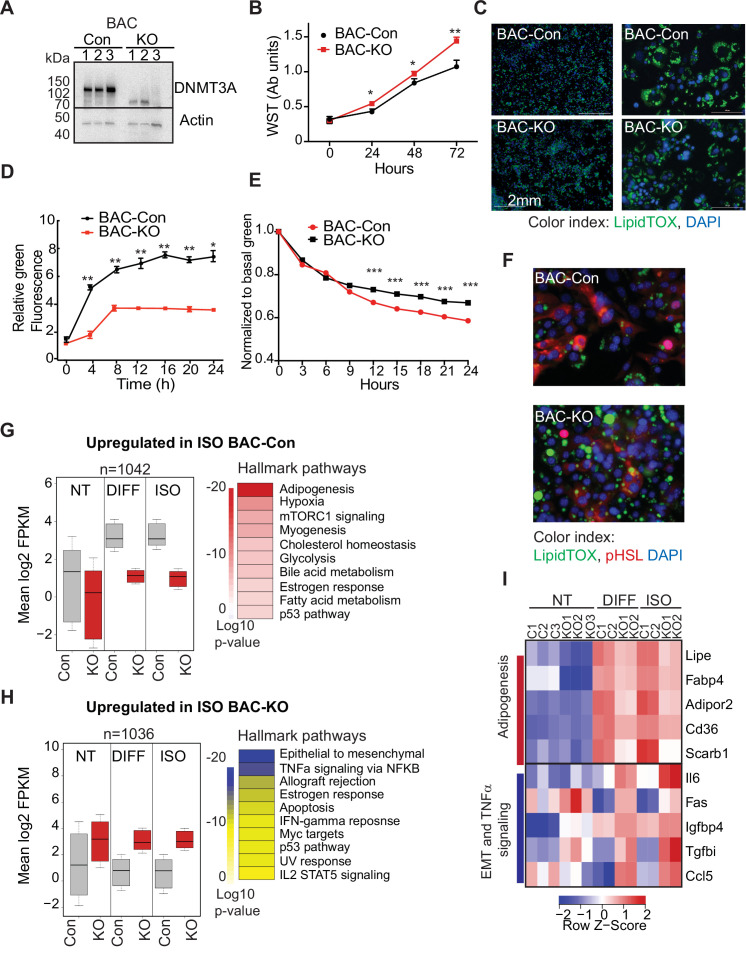
Figure 5—source data 1. RNAseq data from control and Dnmt3a-KO BAC-C4.
Figure 5—source data 2. List of differentially expressed genes overlapping with BAC-C4 and 3T3L1.
Figure 5—source data 3. Western blot probed with DNMT3A antibody after CRISPR KO in BAC-C4 cells. Three clones each of WT and DNMT3A-KO cells are shown.

Figure 5.

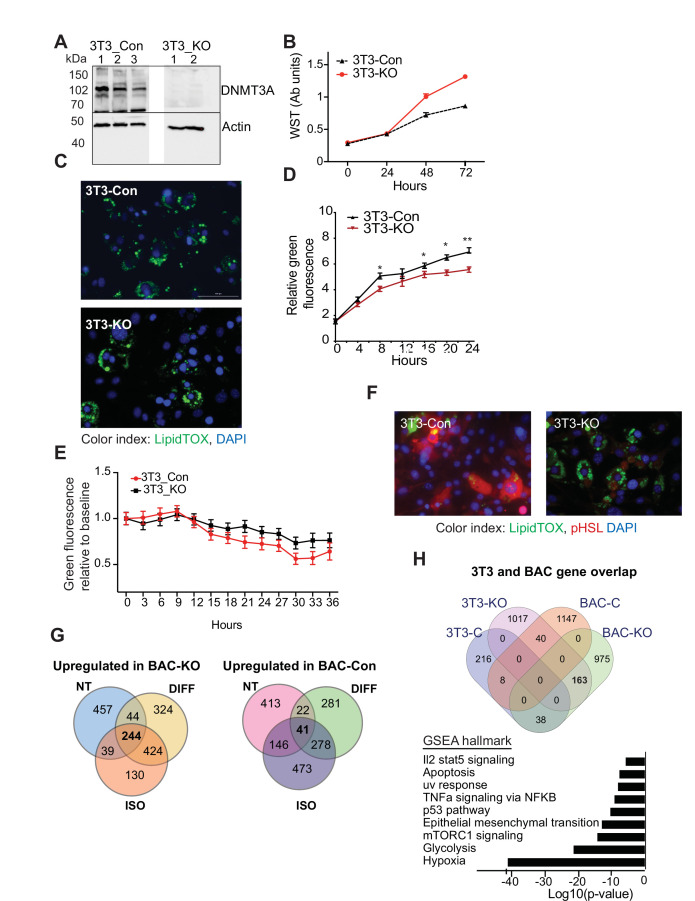
Figure 5—figure supplement 1. DNMT3A is needed for proper lipogenesis and lipolysis.

Figure 5—figure supplement 1.

(A) Western blot performed to validate Dnmt3a knockout (KO) following CRISPR in 3T3-L1 cell line (three clones for control (3T3_Con) and two clones for Dnmt3a-KO (3T3_KO)). Actin antibody was used as loading control. (B) Proliferation assay of 3T3-L1 control and Dnmt3a-KO cells. Assay was based on water-soluble tetrazolium (MTT) assay. (C) Staining of differentiating 3T3-L1 control and Dnmt3a-KO cells. Shown representative LipidTOX (green) staining of lipid droplets following 6 days of differentiation (×20 magnification). (D) Live cell imaging was used at day 5 of differentiation to plot measurement of incorporation of fluorescent fatty acid (BODIPY FL C12 (green)) relative to red nuclear fluorescent staining of KO and control 3T3-L1 proliferating cells. (E) Quantification of lipid release control and 3T3L1 Dnmt3a-KO cells following treatment with isoproterenol. Quantification of green fluorescence from fatty acids was normalized to the level of green fluorescence at baseline. (F) Staining of differentiating 3T3-L1 control and Dnmt3a-KO cells following induction of lipolysis. 3T3-L1 control and Dnmt3a-KO cells were differentiated for 5 days and following treated with isoproterenol for an additional 24 hr. Displayed representative immunostaining of the cells with the indicated antibodies. (G) Venn diagram disapplying overlap of differentially expressed genes in control and KO cells at baseline (non-treated, NT), at day 6 of differentiation (DIFF), and following 24 hours treatment of 5 days differentiated cells with isoproterenol (ISO). (H) Top: Venn diagram disapplying overlap of differentially expressed genes in control and KO following differentiation compared to published RNAseq data performed on differentiated 3T3L1 cells following downregulation of Dnmt3a with siRNA. Bottom: GSEA pathway enrichment analysis of genes upregulated in BAC-KO (fold >2, p ≤ 0.05) and 3T3L1 si-Dnmt3a. Presented as log transformed p-value.
Figure 5—figure supplement 1—source data 1. Western Blot of DNMT3A; source data.