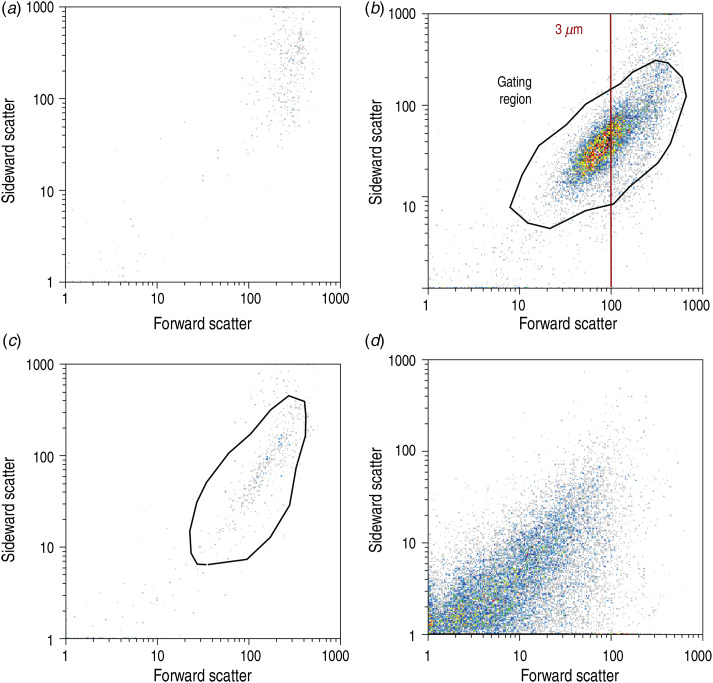
Fig. 2.
Representative data obtained by flow-cytometry-based cell counting. Water samples taken from pond 36, analysed for concentrations of V. cholerae O1, O139, and total cells. Colours indicate the number of counts in each pixel in relation to the total count. (a) Negative control to measure background fluorescence in the water sample without antibody or DNA staining. (b) Ten-μm-filtered water sample with O1-specific staining. The red line indicates the calibration value for spherical beads of 3 μm diameter. The black solid line depicts the gated region used for final counting. (c) Ten-μm-filtered water sample stained with O139-specific antibodies. (d) Thirty-μm-filtered water sample stained with the non-specific DNA dye SYBR Green. The counting was done with the green fluorescence trigger on in order to detect the labelled antibody attached to V. cholerae or the SYBR Green-stained DNA within cells.

