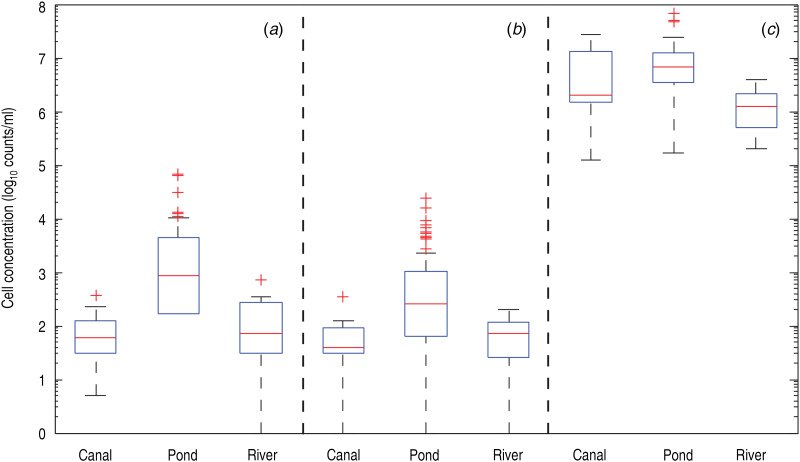
Fig. 4.
Occurrence of V. cholerae O1 and O139 in ponds, irrigation canals, and rivers. Boxplot of measured concentrations of (a) V. cholerae O1 and (b) V. cholerae O139 (10 μm-filtered samples) and of total living cells (c, 30-μm-filtered samples) in water samples of the different water bodies of the study area. The number of sampling sites was 10 for river and canals, and 46 for ponds. The red line indicates the median value, while the edges of the box correspond to the 25th–75th percentile values and the whiskers extend to the extreme datapoints not considered outliers, which are shown with red crosses.

