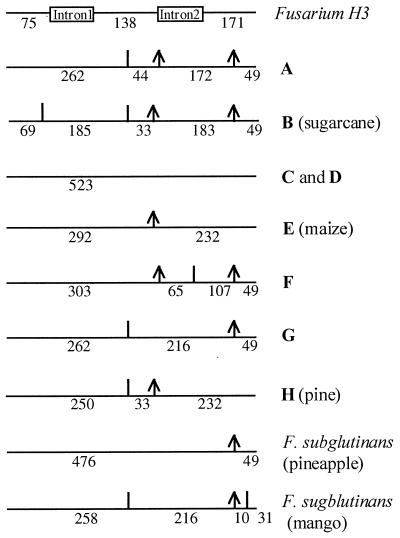
FIG. 3.
Restriction maps of the histone H3 genes from the different isolates of Fusarium, generated with restriction enzymes DdeI and CfoI. The Fusarium introns are indicated as boxes, and the exons are indicated as horizontal lines. Bold letters refer to the G. fujikuroi mating populations. An arrow indicates a CfoI restriction site, and a vertical line indicates a DdeI restriction site. Exon and fragment sizes are indicated in base pairs.

