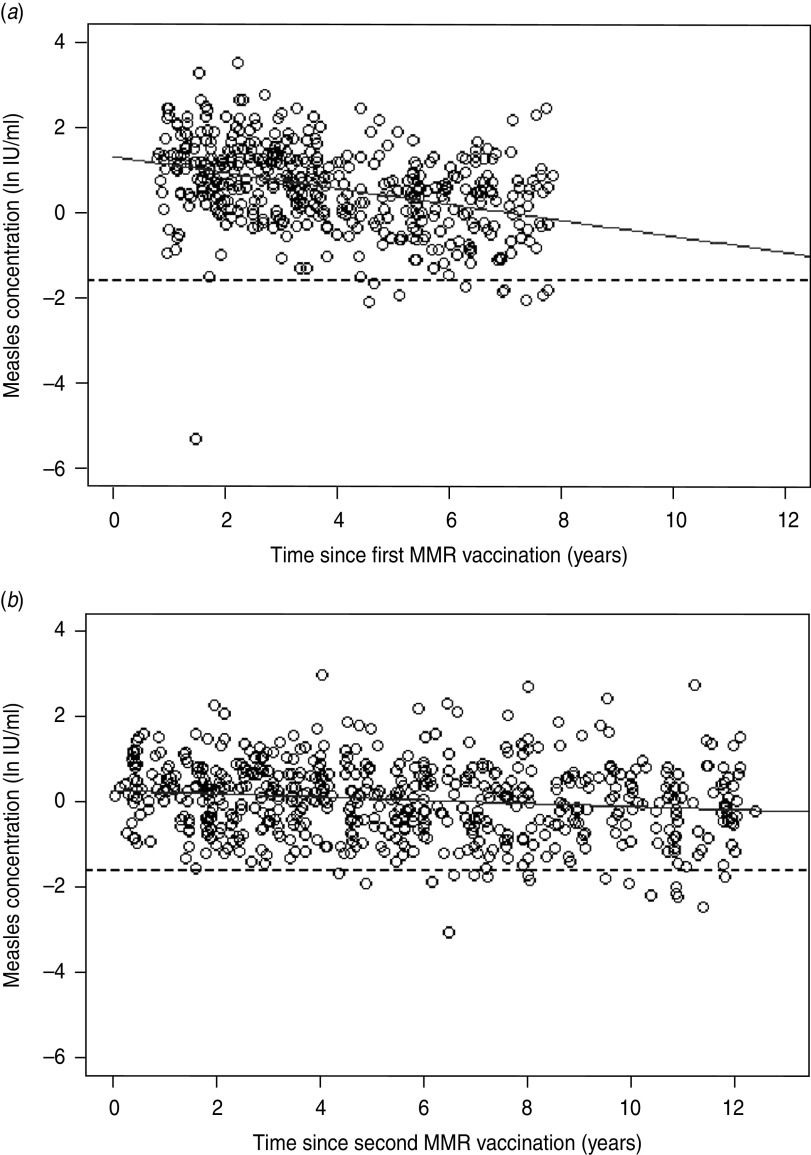
Fig. 2.
Persistence of measles IgG antibodies after MMR vaccination. (a) The effect of time on the antibody concentrations (i.e. y in ln IU/ml) induced by the first MMR vaccination (i.e. x in years) (y = 1·3−0·2x). (b) The effect of time on the antibody concentrations induced by the second MMR vaccination (y = 0·3−0·04x). The solid line represents the fitted model and the dotted line represents the cut-off for seropositivity (ln(0·2) IU/ml).

