
Fig. 1.
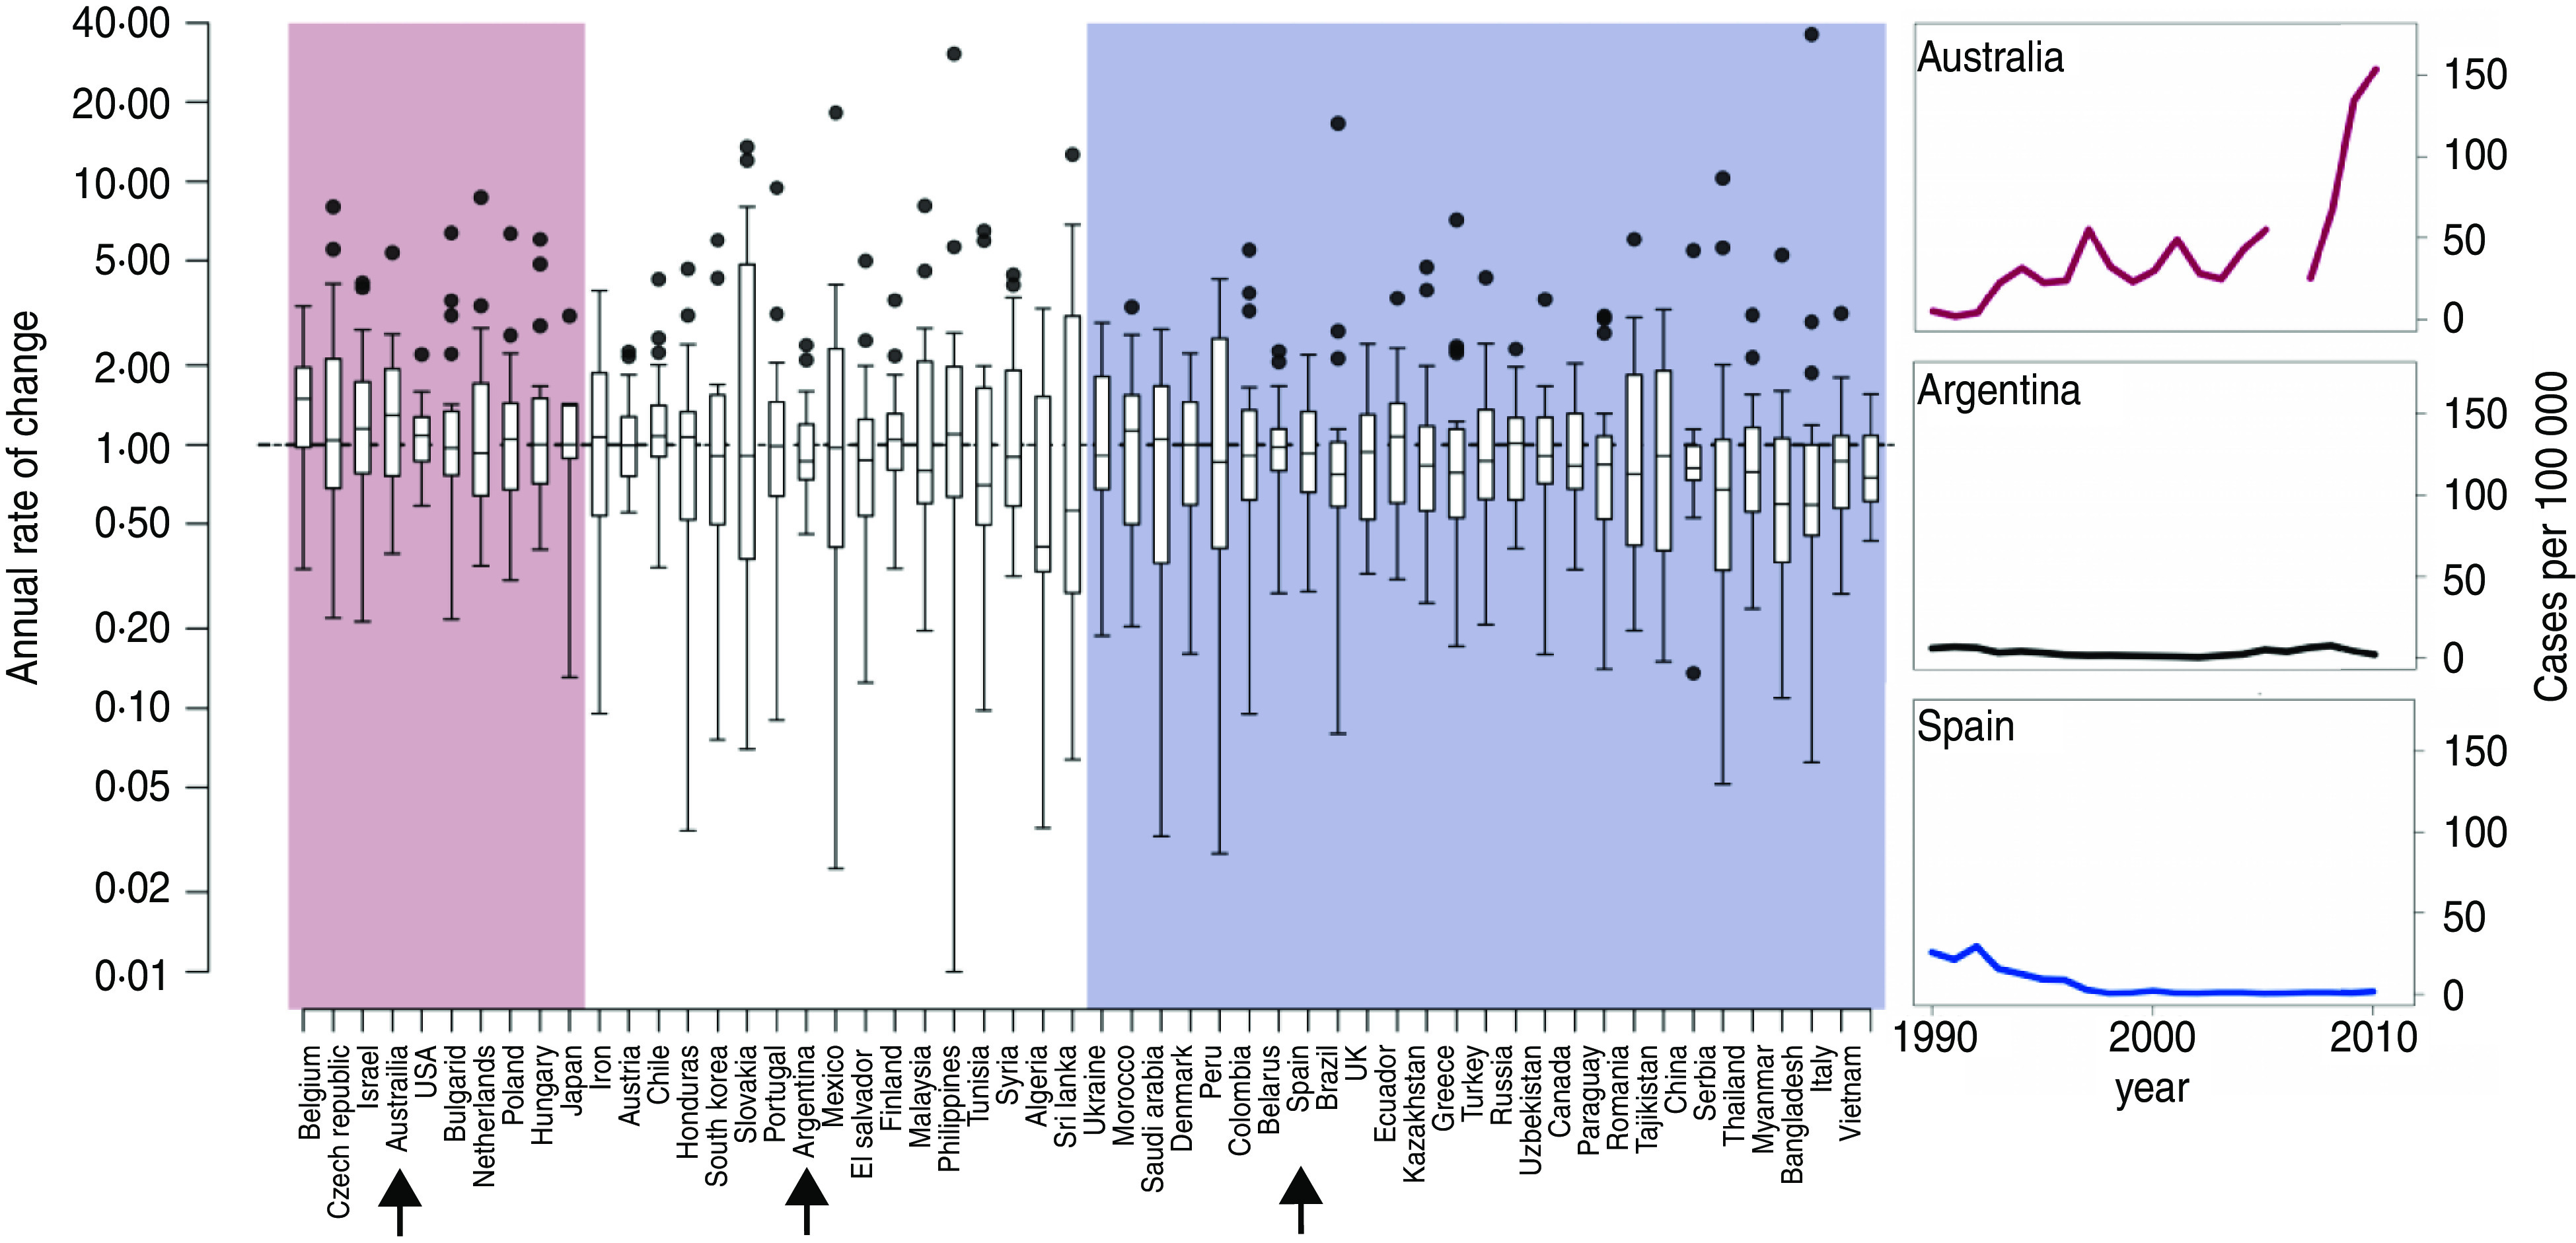
[colour online]. Boxplot of annual rates of change of pertussis incidence between 1990 and 2010 for countries that met our inclusion criteria: mean DTP3 vaccine uptake of >80% between 1990 and 2010; populations of >5 million individuals; and >80% complete case count records for this time period. The pink area indicates countries with significantly positive trends in incidence based on Kendall's tau rank correlation (P < 0·05), white indicates countries for which trends were not significant, and blue indicates countries with significantly decreasing trends. Note that rates of change are plotted on a log scale. Representative time-series of countries with increasing (Australia), stationary (Argentina), and decreasing (Spain) trends are shown on the right.