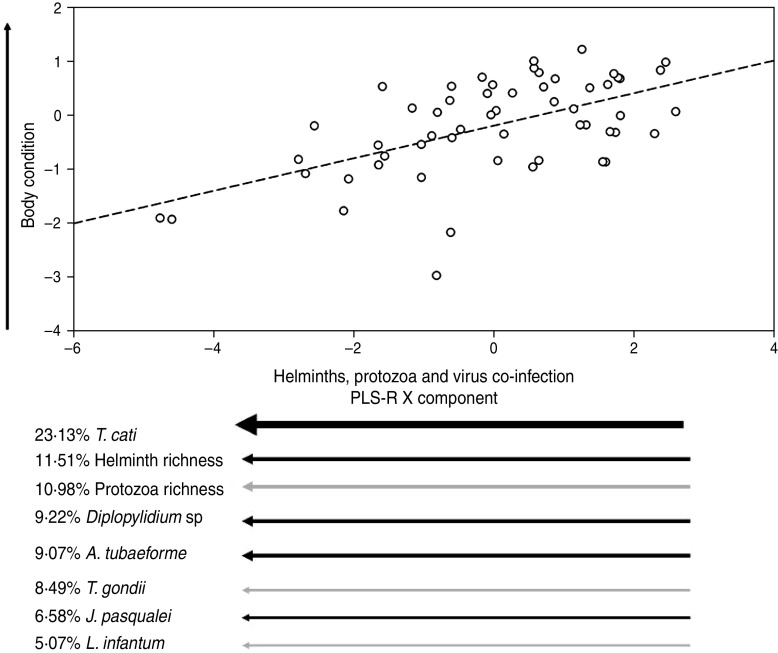
Fig. 1.
Relationship between co-infecting helminths (black arrows) and protozoa (grey arrows) on a PLS-R component describing the body condition of adult feral cats. This plot represents the best PLS-R model shown in Table 2. Arrow direction indicates either an increase or a decrease of the component value, and arrow thickness directly indicates the weight of the component. Viruses explained <5% of the PLS-R X component and were therefore excluded from the plot.

