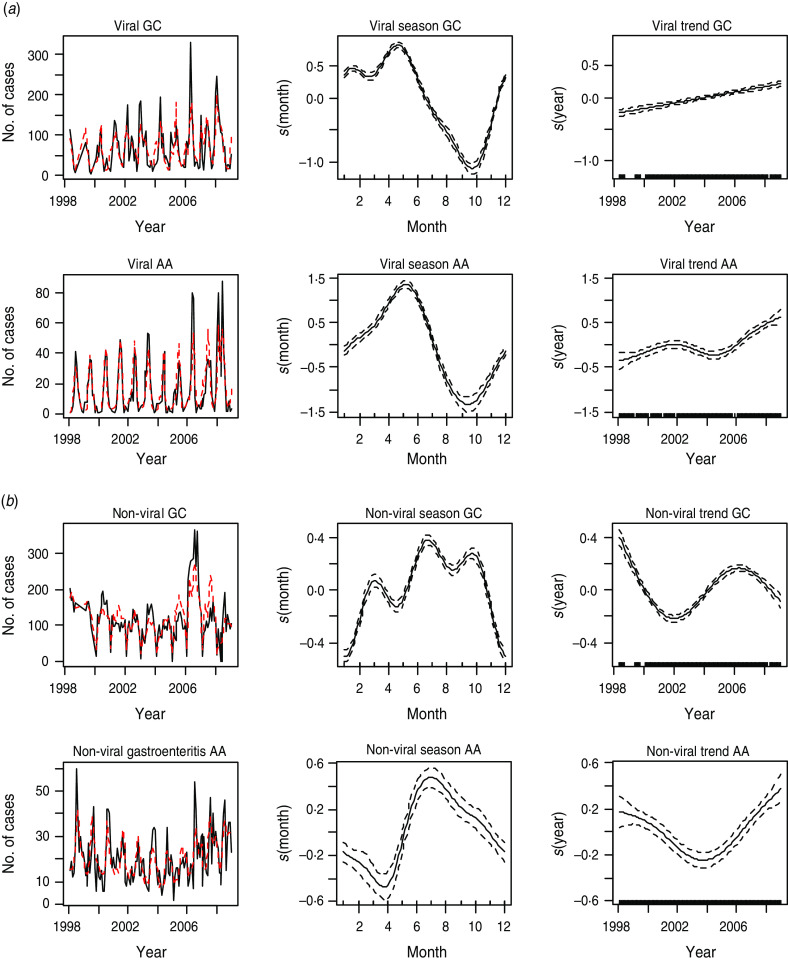
Fig. 2.
[colour online]. (a) The first panel shows the observed monthly counts (solid line) and model estimates (dotted line) of viral gastroenteritis. The second and third panels show the seasonal and trend patterns, respectively, of viral intestinal infections in Glasgow & Clyde (GC) and Ayrshire & Arran (AA), respectively. (b) The first panel shows the observed monthly counts (solid line) and model estimates (dotted line) of non-viral gastroenteritis. The second and third panels show the seasonal and trend patterns, respectively, in GC and AA.

