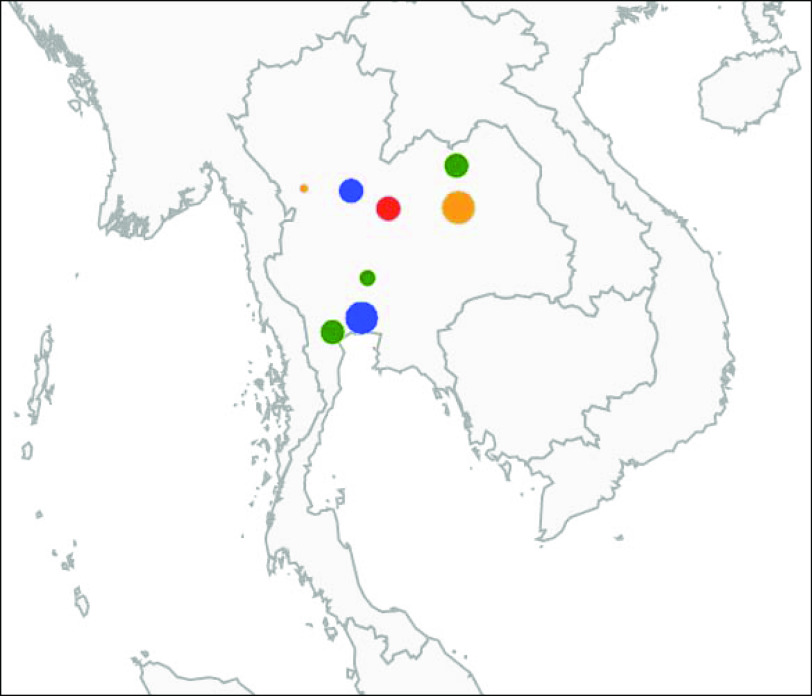
Fig. 2.
[colour online]. Representation of the human clusters detected in 2003. Each marker colour represents a serovar (blue: S. Anatum; green: S. Enteritidis; red: S. Stanley; orange: S. Rissen). The size of the markers is scaled according to the number of isolates involved in each cluster. The clusters represented are cluster numbers 18, 19, 20, 21, 22, 23, 24 and 25 from Table 3.

