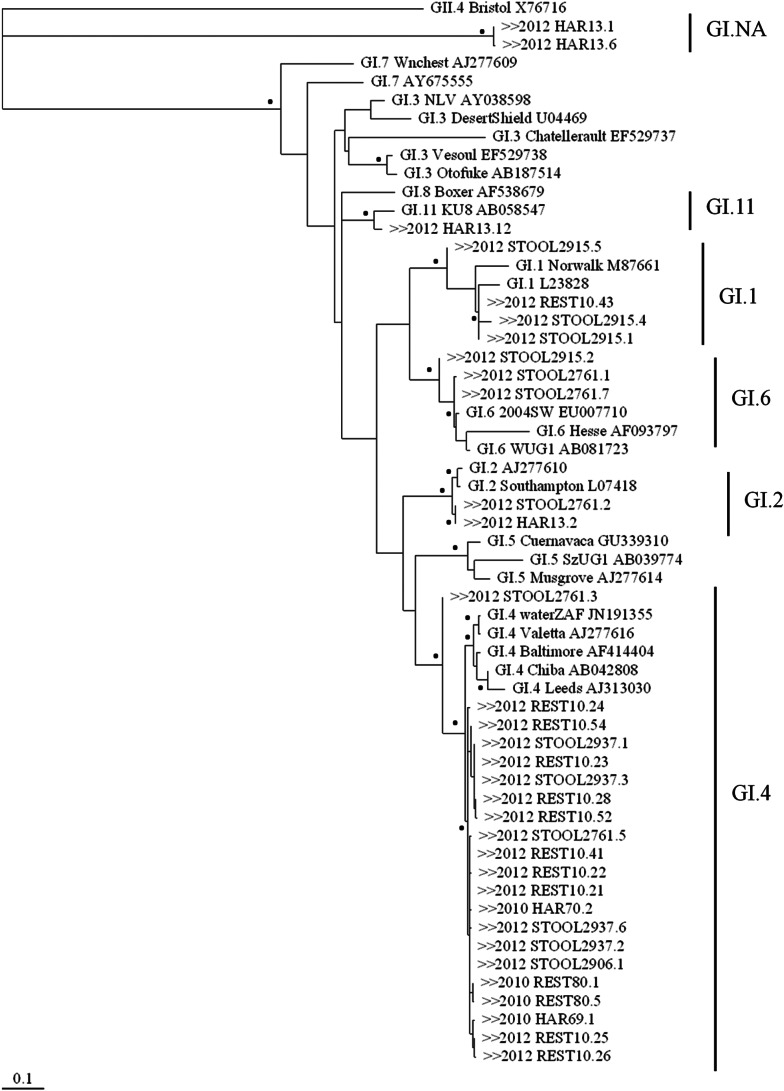
Fig. 1.
Maximum-likelihood tree based on capsid N/S domain (285 bp) of the NoV GI sequence alignment. Bootstrap analysis was performed for 1000 replicates of the dataset and values of >70% are indicated by the black dots beside the appropriate branch. NoV GI sequences detected during outbreaks 1 and 2 are preceded by ‘>>2010’ and ‘>>2012’, respectively. The lower scale represents genetic distances in nucleotide substitutions per site.

