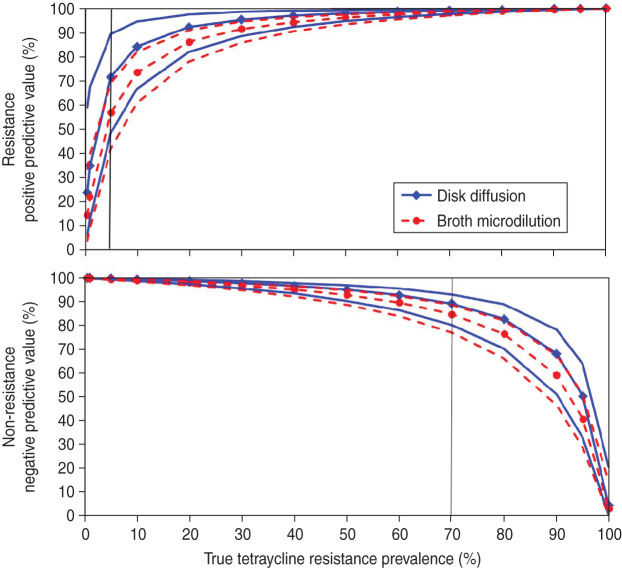
Fig. 2.
[colour online]. Predictive values and 95% probability intervals for resistance (positive predictive value) and non-resistance (negative predictive value) to tetracycline by disk diffusion (diamond with solid lines) and broth microdilution (circle with dashed lines) in E. coli isolated from individual samples (n = 2238). Vertical lines denote the true prevalence of streptomycin resistance at low (5%) and high (70%) levels to illustrate large differences in predictive values between the two antimicrobial susceptibility tests. Lines without markers indicate the 95% probability intervals. (Colour online: blue solid lines for disk diffusion and red dashed lines for broth microdilution.)

