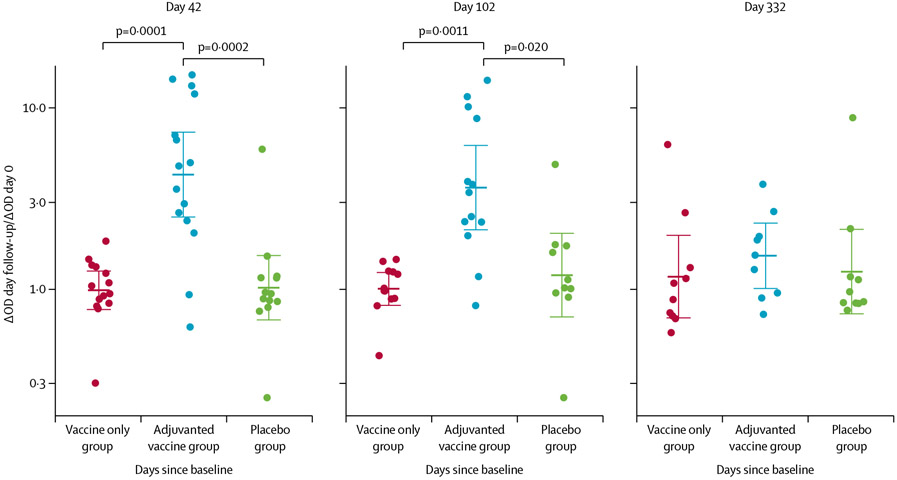
Figure 3: Vaccine-specific total IgG antibody responses in three treatment groups.
Each datapoint is the ratio of ΔOD values at the day of follow-up compared with at baseline and bold bars are geometric means of the ratios and the whiskers are 95% CIs. Each treatment group included at least 15 participants in the intention-to-treat analysis. Holm’s-corrected p values for treatment group differences that are significant are shown at the top of the figure. OD=optical density.

