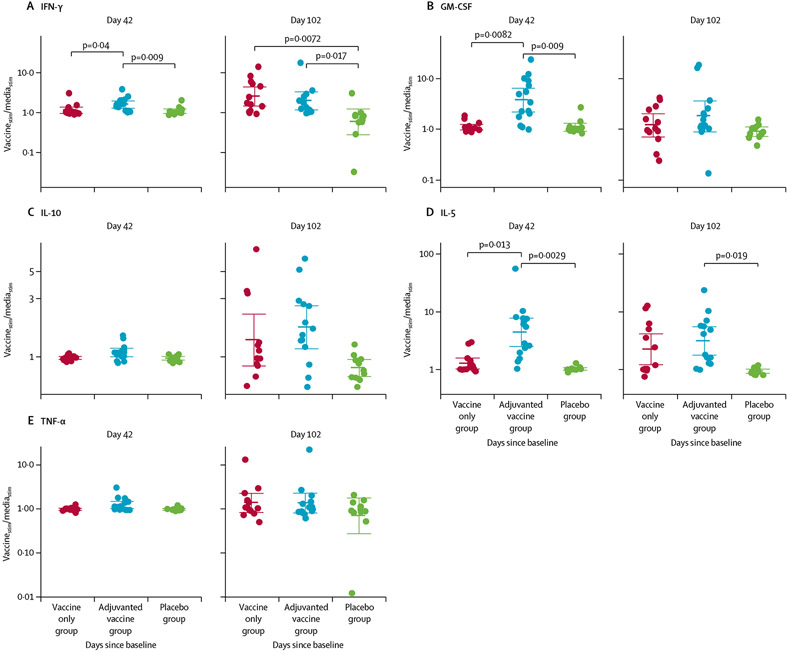
Figure 4: Cellular response to vaccine peptides.
Each datapoint is each participant’s ratio of cytokine response when stimulated with vaccine peptides (vaccinestim) compared with media (mediastim), and bold bars are geometric means of the ratios and the whiskers are 95% CIs. Peripheral blood mononuclear cells collected on day 42 and day 102 were stimulated with: vaccine peptides at 4 μM, media as a negative control, and Concanavalin A as a positive control. Holm’s-corrected p values for treatment group differences that are significant are shown at the top of the figure.

