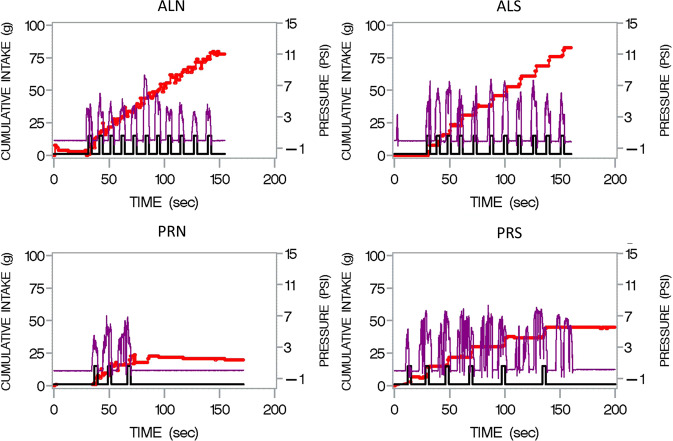
Fig. 1. “Sipograph” Graphical display of intake (red line) reinforcement (black line) and pressure exerted (purple line) by participant consuming from the sipometer [55] under continuous reinforcement (AL) for 2 min (upper panels) or progressive ratio (“PR”) for unlimited time (lower panels) when the reinforcer was either a non-sweetened (N left) or sweetened (S right) Kool Aid.
The pressures are greatest when the participant was sipping on the progressive ratio schedule for the sweet as compared to the non-sweet beverage. The challenge here is to quantify these pressure waves so that individuals and beverages can be compared.

