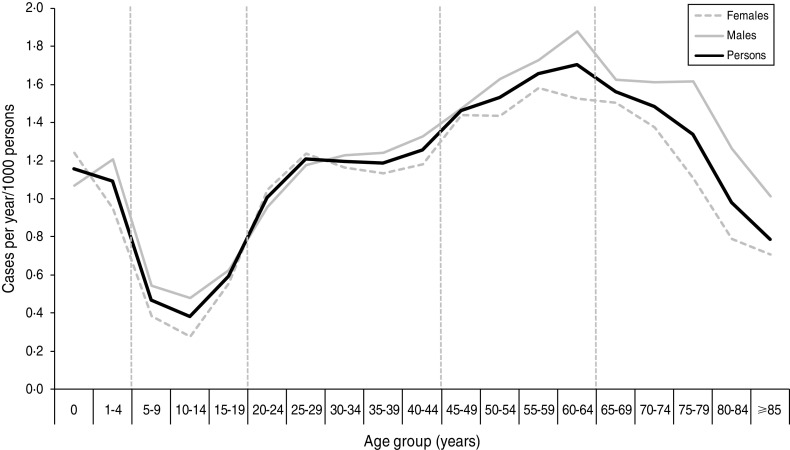
Fig. 2.
Incidence rate of laboratory-confirmed Campylobacter spp. cases by quinary age groups and sex in the North East of England, 2008–2011. Vertical broken lines represent divisions between age groups used for this study. The figure contains an additional 107 cases from 2007 which were included in the study dataset for simulated runs for January 2008.

