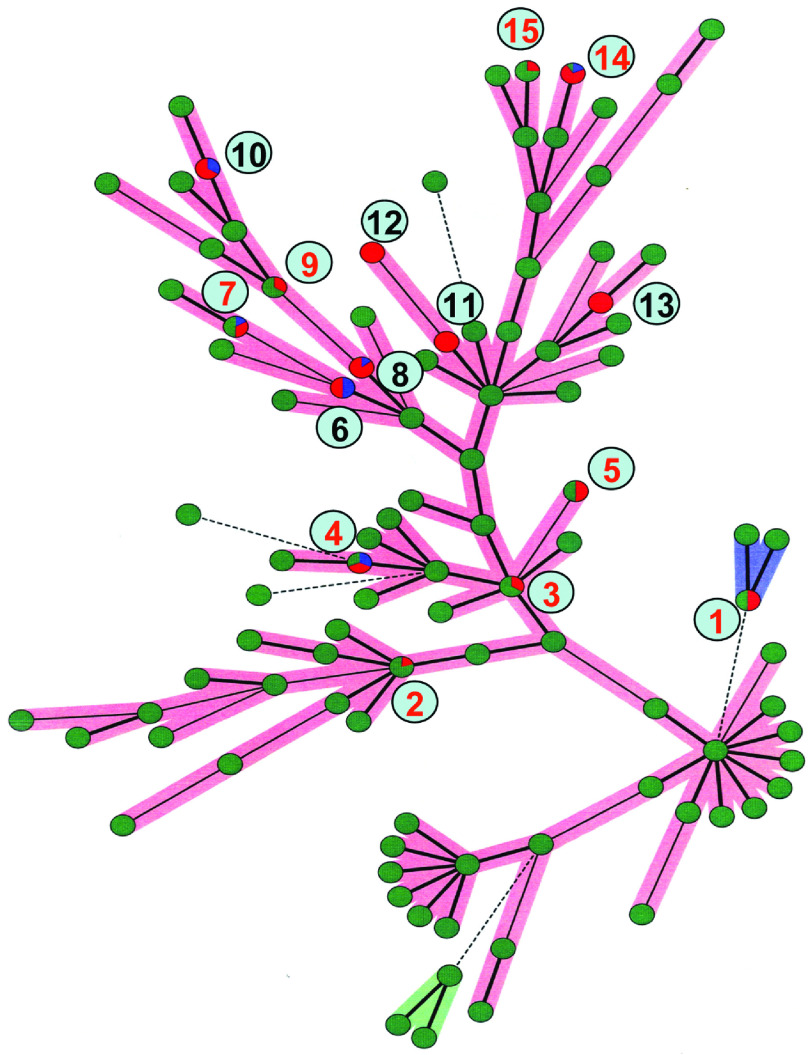
Fig. 3.
The minimum spanning tree diagram showing the clonal relationships between isolates. Difference in the relationship between profiles is indicated by thick lines, thin lines, and dotted lines. The thickness and dotting of lines indicate the distance between the circles, thus a thicker line denotes a closer distance than a thin line, and a thin line denots a closer distance than a dotted line. Single-coloured green dots represent profiles obtained from human isolates only, red dots represent isolates from fish-processing environment only and blue circles represents fish isolates only. The multicolour dots show shared multiple-locus variable-number tandem repeat analysis (MLVA) profiles. The diagram includes 15 distinct MLVA profiles, numbered from 1 to 15 in the figure. Nine MLVA profiles from fish samples or from the fish-processing environment matched human profiles, and are numbered in red (nos. 1, 2, 3, 4, 5, 7, 9, 14, 15). For the remaining profiles (nos. 6, 8, 10, 11, 12, 13) there was no overlap between human profiles and profiles from fish samples or from the fish-processing environment.

