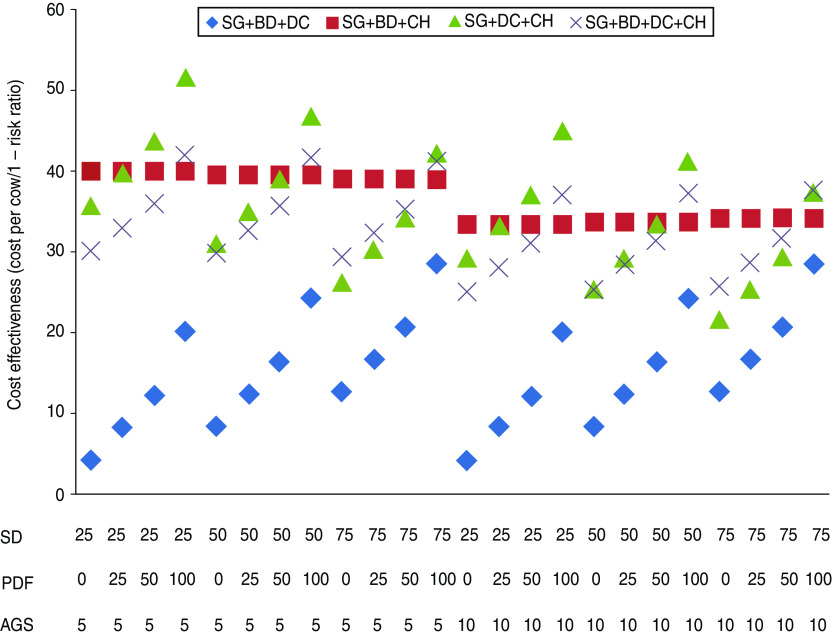
Fig. 5.
[colour online]. Mean cost-effectiveness of combinations of more than two interventions for different herd scenarios. X-axis values refer to SD and PDF percentage and AGS number in each scenario. SD = Percentage of cows served to dairy semen; PDF = percentage of perimeter requiring double fencing; AGS = average group size purchased/quarantined; SG = keeping animals in the same group; BD = keeping bedding dry; DC = limiting direct contact of animals between neighbouring farms; CH = maintaining a closed herd through the use of quarantine.

