
Fig. 1.
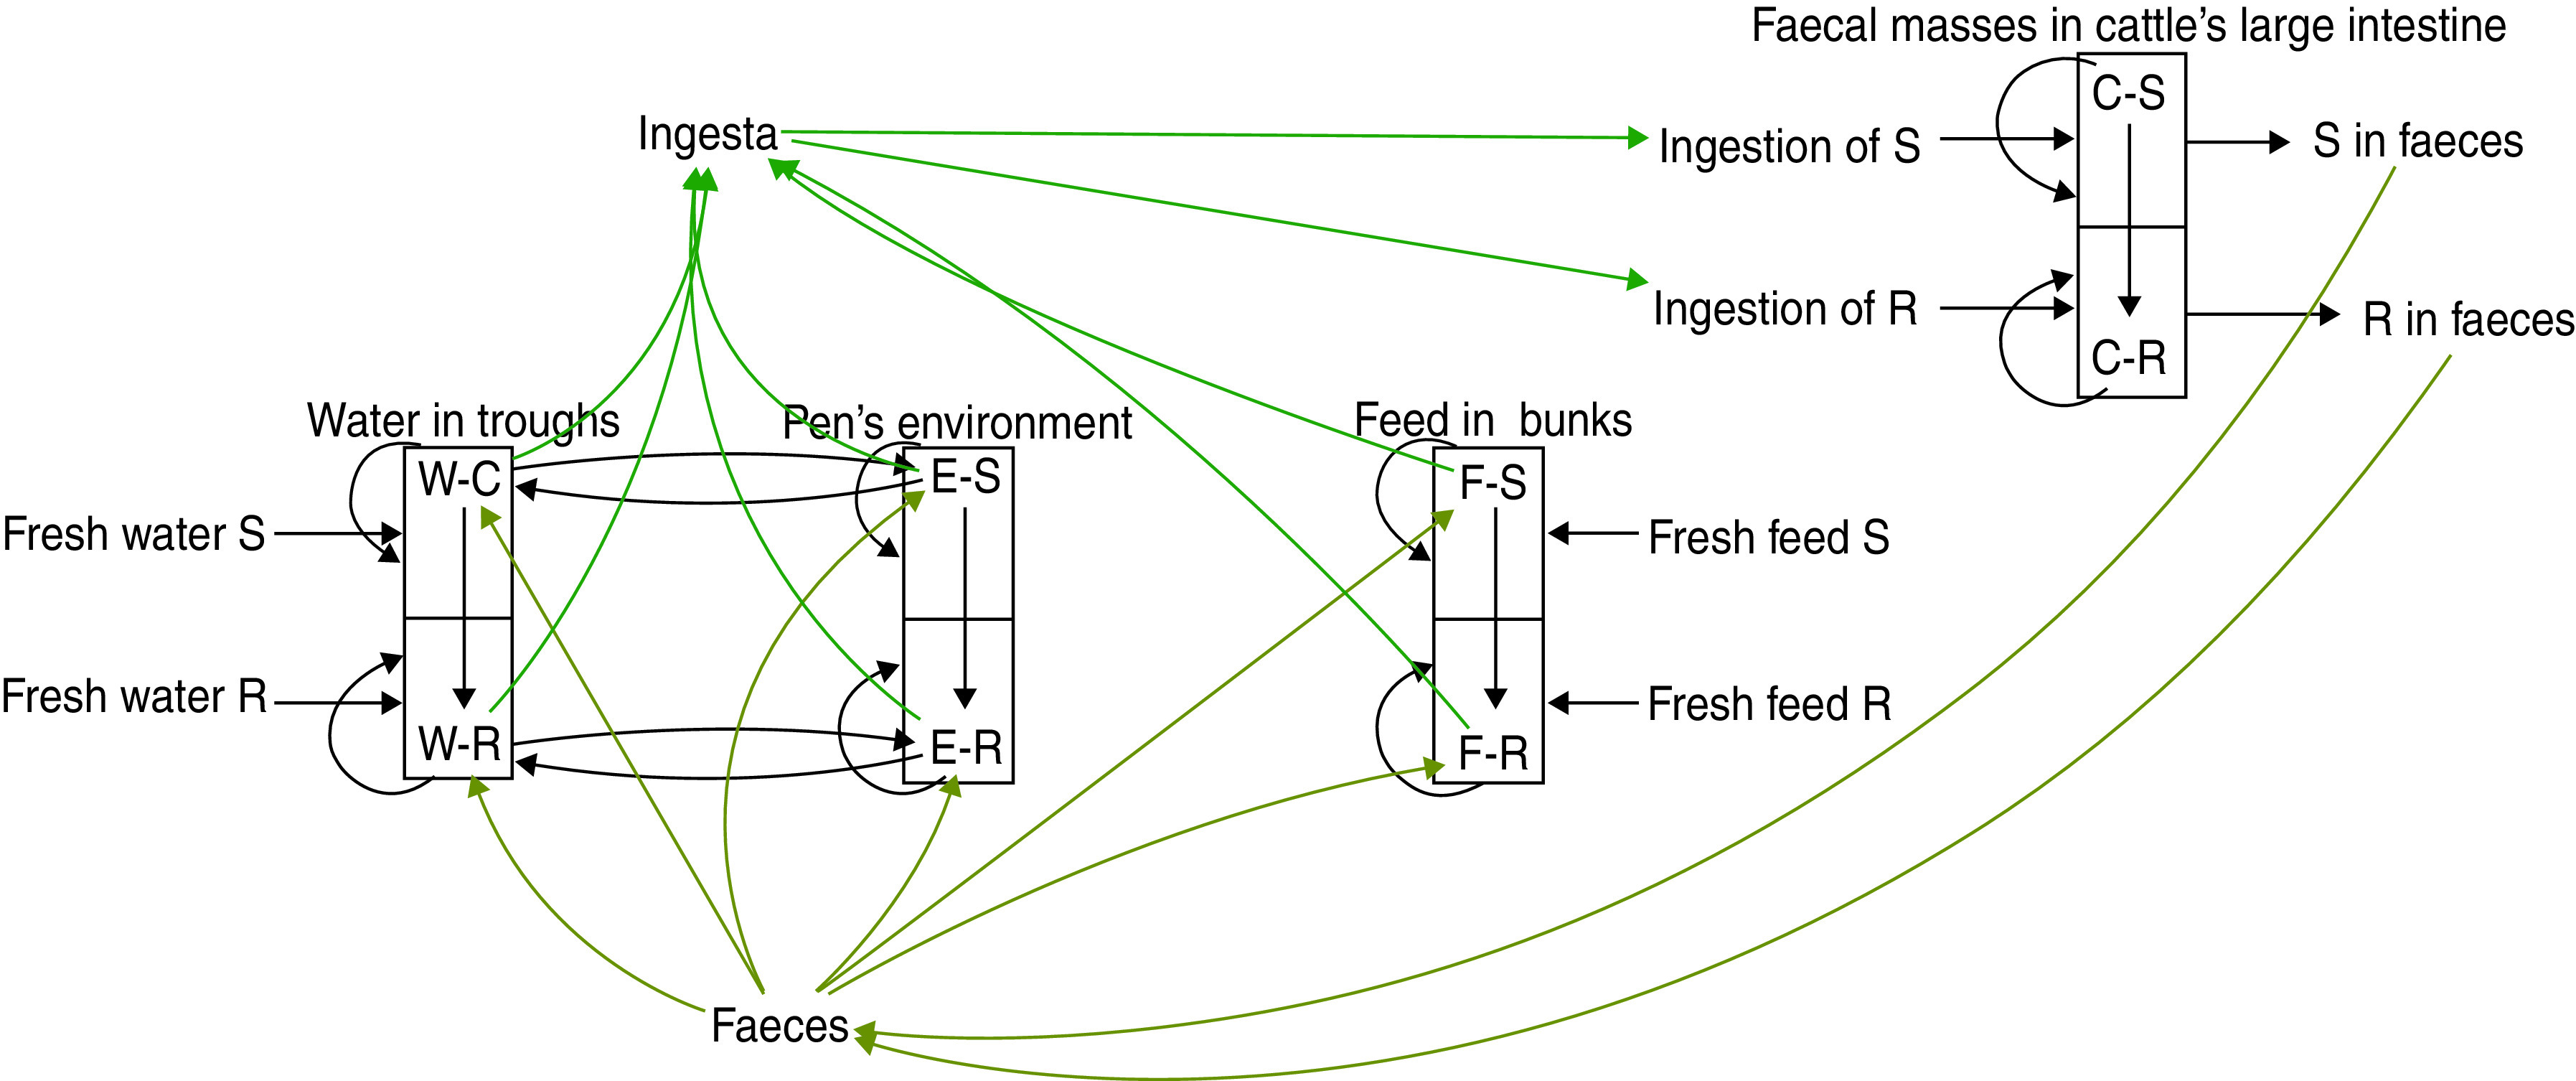
[colour online]. Schematic diagram of the model of commensal E. coli in the within-pen habitats. C, Enteric; W, water in troughs; F, feed in bunks; E, the rest of the environment. S, R, the number of sensitive (S) and resistant (R) E. coli. The arrows show bacterial flows with green for those related to ingesta, yellow for those related to faeces, and black for all others including bacterial population growth and the flow of sensitive cells becoming resistant upon acquisition of plasmids carrying genes of antimicrobial resistance.