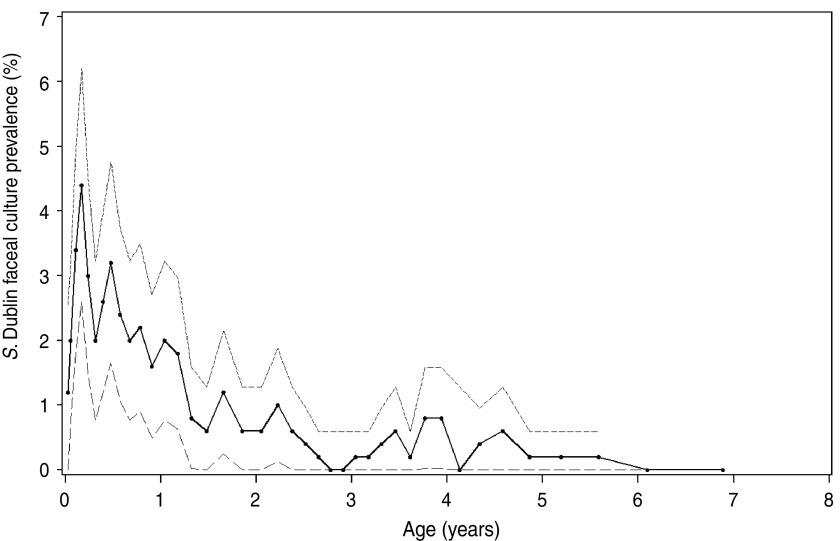
Fig. 3.
Prevalence of Salmonella Dublin faecal-culture positive cattle 14 endemically infected dairy herds tested repeatedly during 2000–2002. The solid lines show the mean prevalence in rolling intervals and the dashed lines the 95% confidence intervals. Points show average age of the rolling intervals, each containing 500 observations.

