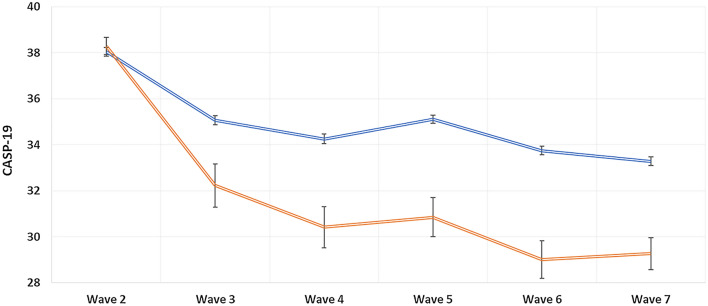
Fig. 2.
Changes of quality of life, during follow-up, by presence of sarcopenia or not at baseline (weighted data). Data are reported as mean and standard errors by presence of sarcopenia (red line) and absence of this condition (blue line), matching people with and without sarcopenia for CASP-19 values at wave 2. Analyses were adjusted for age (as continuous variable); gender; years of education (as continuous variable); ethnicity (whites vs. non-whites); marital status (married vs. other status); smoking status (ever vs. never); Center for Epidemiologic Studies Depression Scale (as continuous variable); physical activity level (high vs. others); presence of multimorbidity (yes vs. no)

