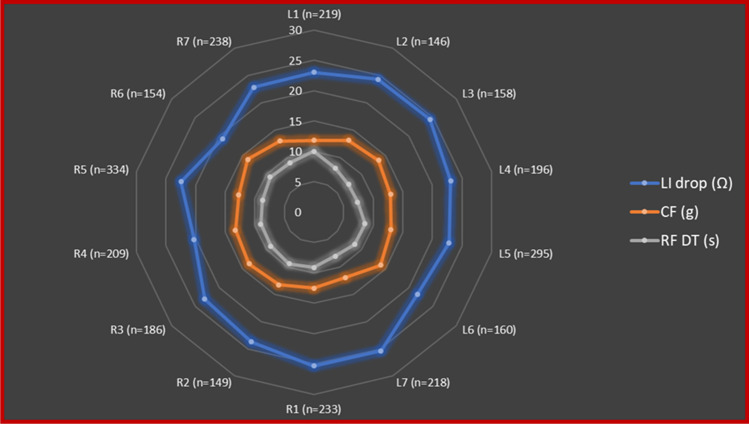
Fig. 5.
Details of the distribution of RF applications, CF, ablated tissue impedance values, and RF delivery times according to location sites. This Kiviat chart displays multivariate data with values represented on axes starting from the same point. Each apex of the Kiviat charts represents a location site according with seven distinct sections of right (R) and left (L) pairs of PVs (anterior superior R1, L1; anterior inferior R2, L2; inferior R3, L3; posterior inferior R4, L4; carina R5, L5; posterior superior R6, L6; superior R7, L7). Blue, orange, and grey dots represent the mean LI drop values, CF values, and RF delivery time values according to location sites

