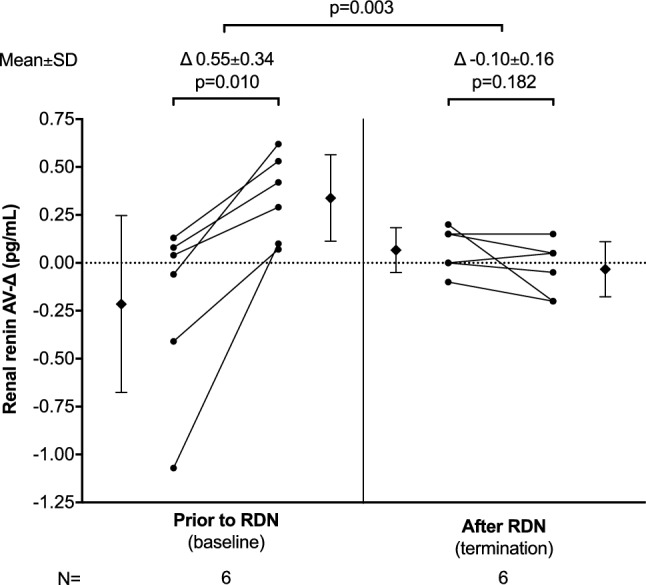
Fig. 5.

Renal renin arteriovenous difference following a hypotensive challenge before and after RDN. At baseline (prior to RDN) and before termination (after RDN), the treatment group animals underwent a hypotensive challenge. Blood samples from the renal artery and vein were drawn before and after the hypotensive challenge. Renin concentrations were measured using a porcine renin ELISA kit (NeoBiolab, Cambridge, MA, USA) and renal renin arteriovenous difference (AV-Δ) was calculated by subtracting the arterial from venous renin concentration. Complete renin secretion data was available in 6 animals at baseline and termination
