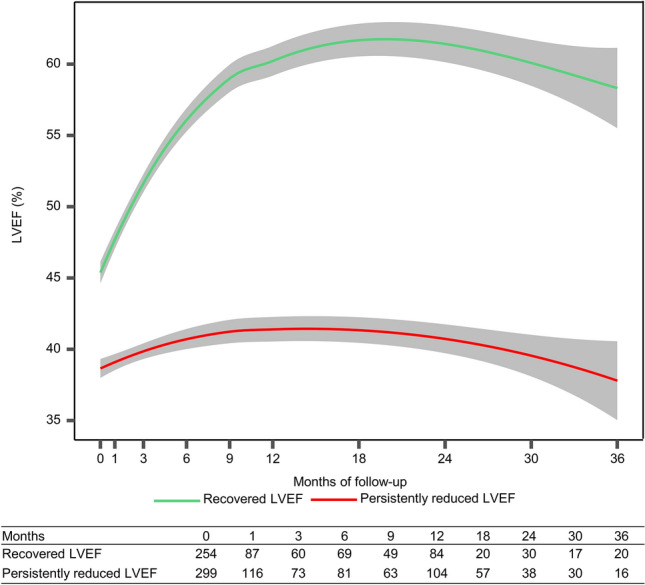
Fig. 2.

Comparison of long-term LVEF trajectories between patients with recovered LVEF (green) and persistently reduced LVEF (red). P = 0.057 for LVEF trajectory changes for patients with persistently reduced LVEF, P < 0.001 for LVEF trajectory changes for patients with recovered LVEF; P < 0.001 for comparison between the two groups. Shaded regions represent 95% confidence interval. The table shows the number of LVEF values at each time points
