
Fig. 3.
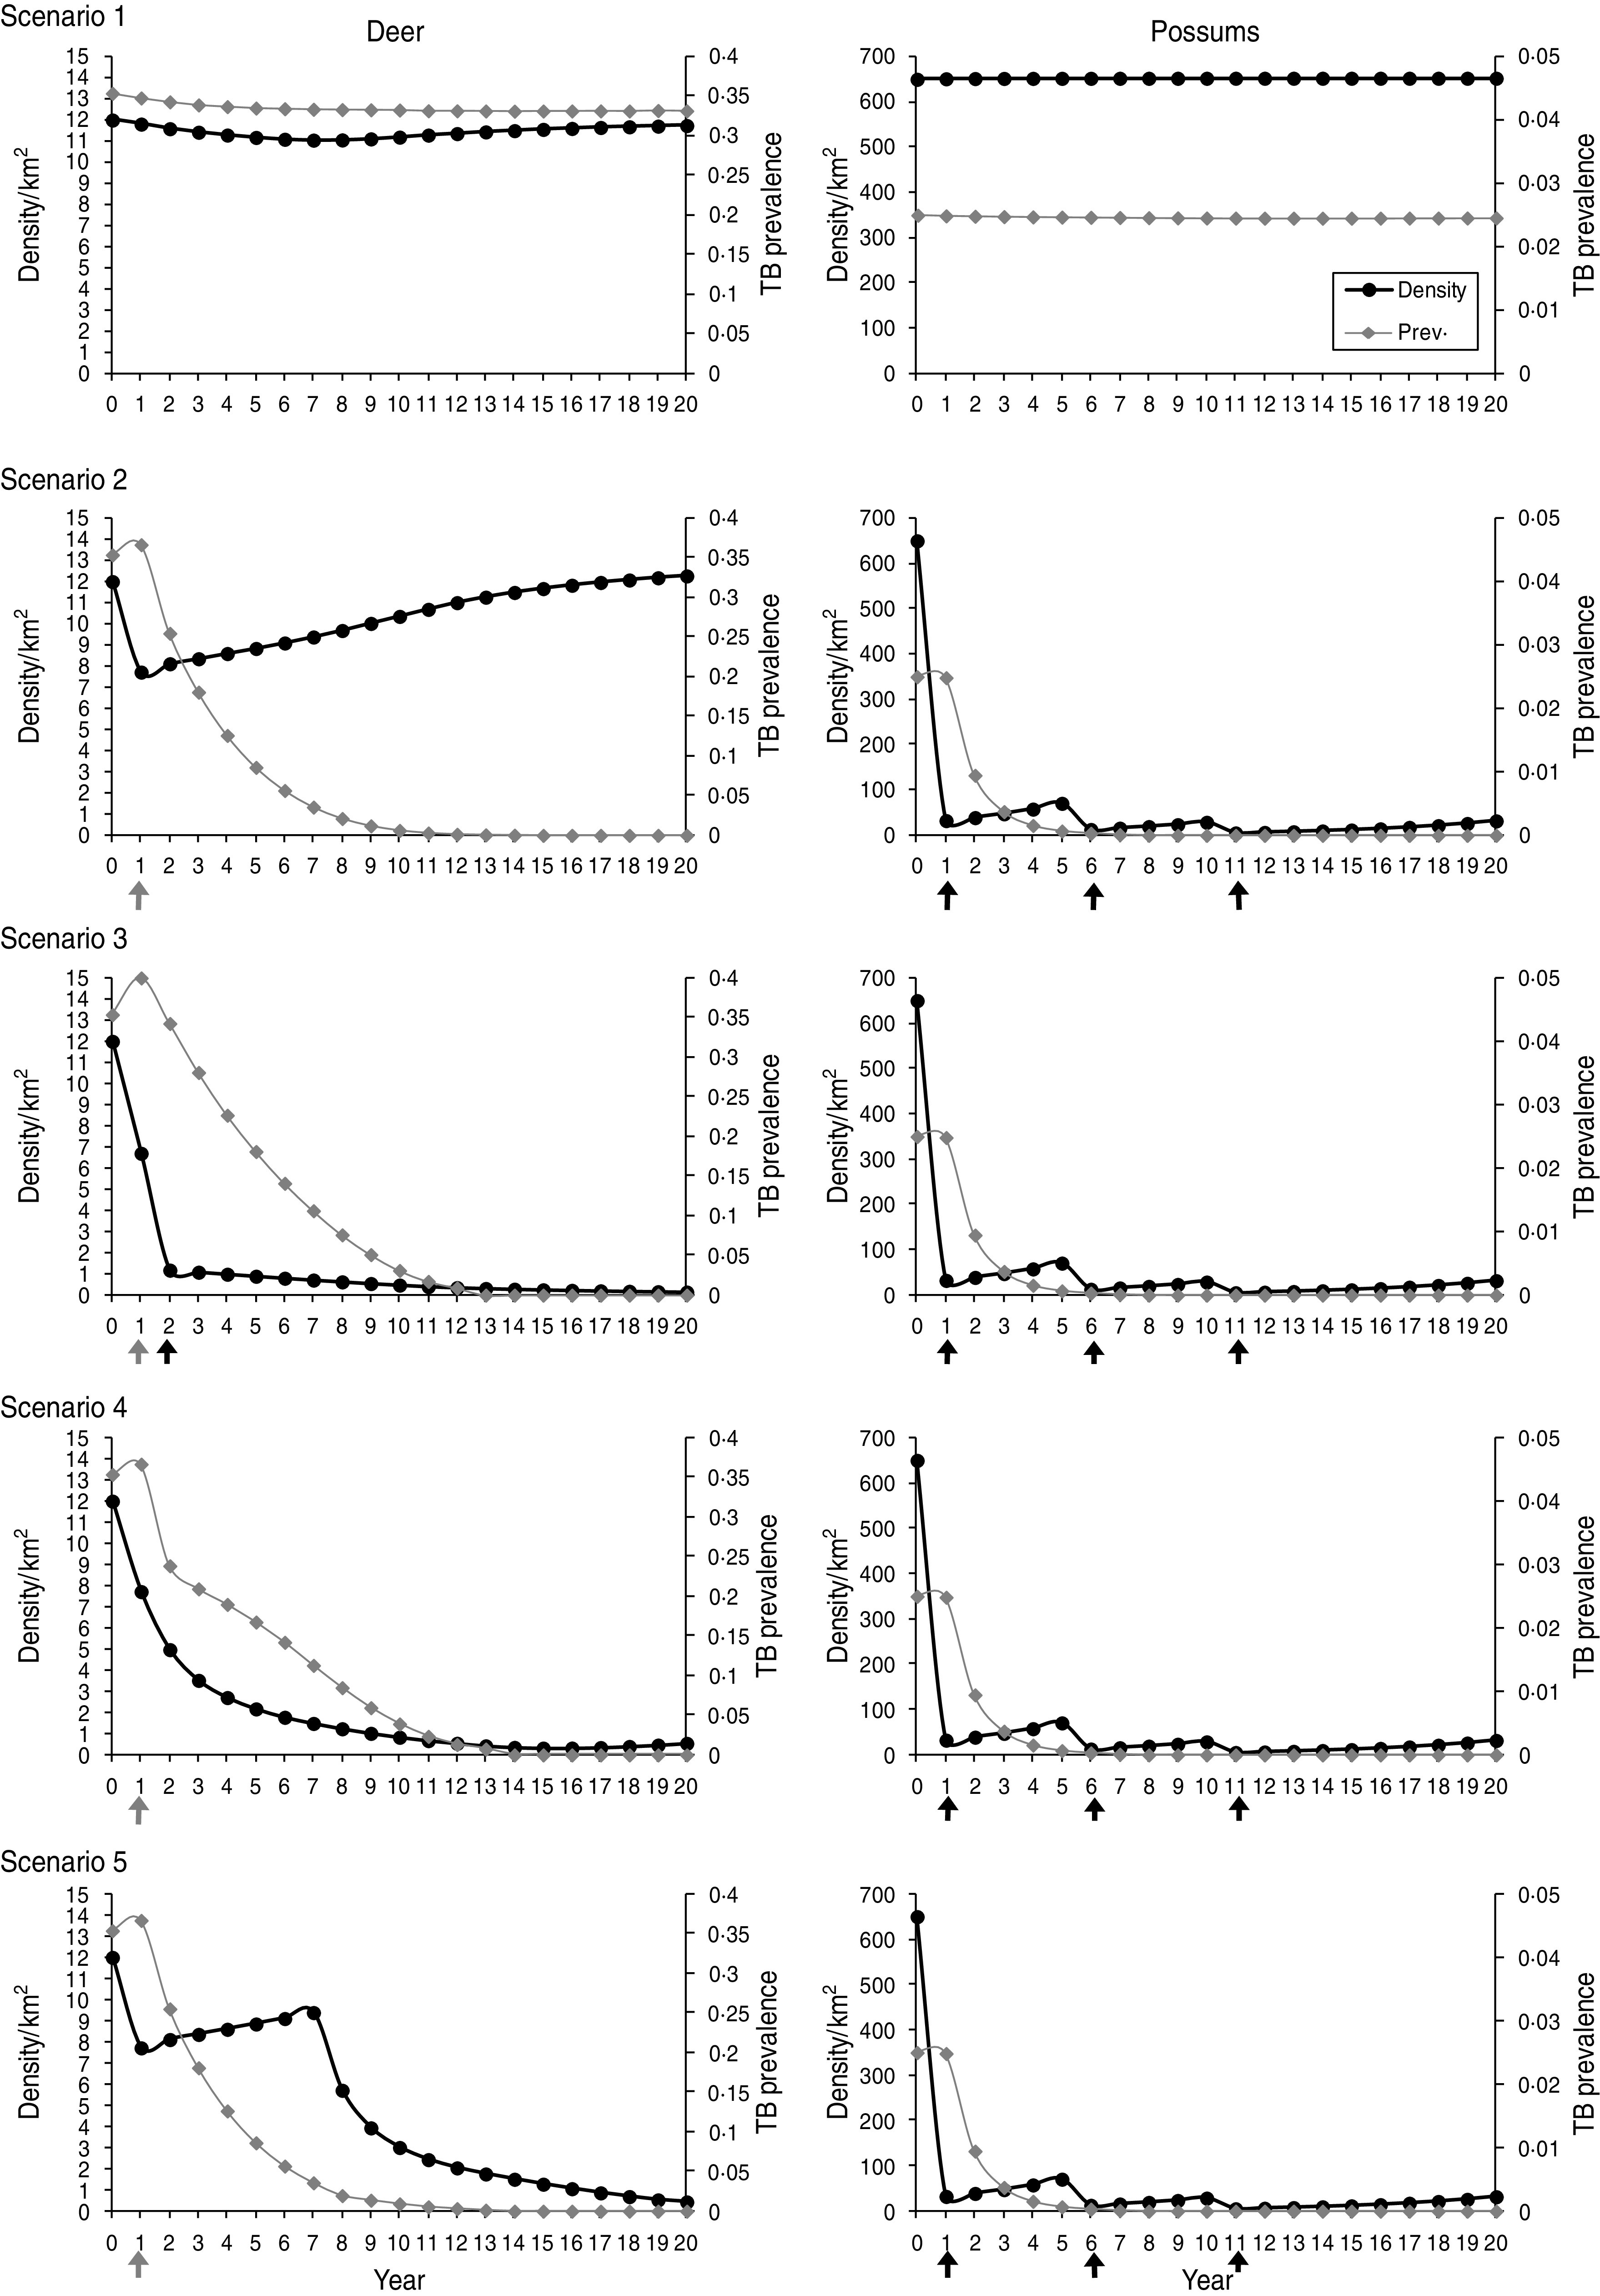
Changes in mean deer and possum density, and tuberculosis (TB) prevalence predicted under control scenarios 1–5. Black lines indicate host population density, Grey lines indicate TB prevalence within host population. Arrows along the horizontal axes refer to major pest population reductions of ⩾80% due to targeted poison control operations (black symbols), or 30% due to by-kill (grey symbols), for scenarios 2–5.