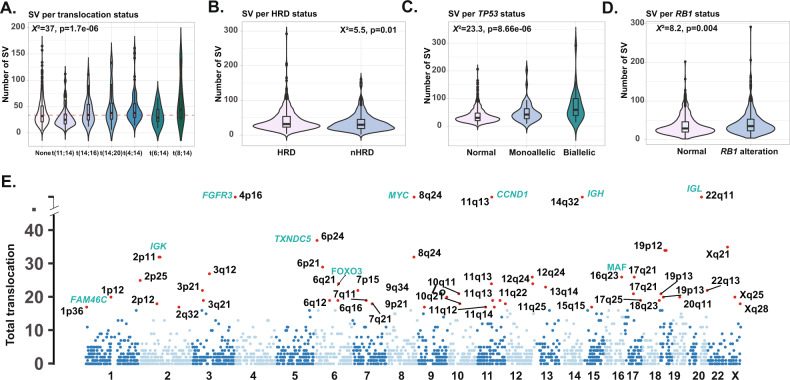
Fig. 1. Distribution of SV across the genetic subgroups of NDMM (n = 812).
A Violin plot suggesting t(4;14) have more SVs and t(11;14) fewer SVs. B Violin plot suggesting HRD samples have fewer SVs than nHRD samples. C Violin plot suggesting there are more SV in both monoallelic and biallelic TP53 inactivated cases. D Violin plot suggesting SVs are associated with RB1 alterations. E Plot displaying the number of translocations according to their chromosomal location highlighting hotspots of interest (genes in green).

