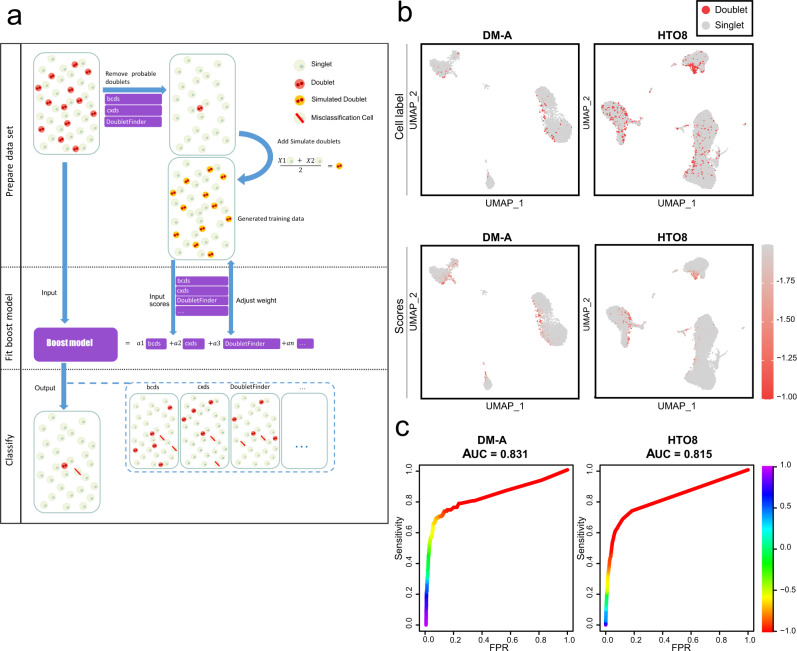
Fig. 1. Chord overview and its performance on the DM-A and HTO8 tests.
a Schematic outline of the Chord workflow. First, preliminarily predicted doublets are filtered using bcds, cxds and DoubletFinder, and then the processed dataset is randomly sampled to generate simulation doublets that are added to the training dataset. The second step is to fit the weights of the integrated methods through the GBM algorithm on the training dataset. In the third step, the ensemble model is used to evaluate the original expression matrix and the doublets are identified by the expectation threshold value. b UMAP was embedded for the DM-A and HTO8 tests with experimental doublet labels. The doublets are shown in red, and the singlets are shown in grey. The doublet prediction scores of Chord were visualised on the UMAP plots for the DM-A and HTO8 tests. The DM-A dataset was from human peripheral blood mononuclear cell (PBMC) samples using the experimental demuxlet method to annotate doublets11. The HTO8 dataset was from the samples of PBMC using eight barcoded antibodies to mark and label doublets9. c The ROC curves of Chord were drawn for the DM-A and HTO8 tests using the R package PRROC29.

