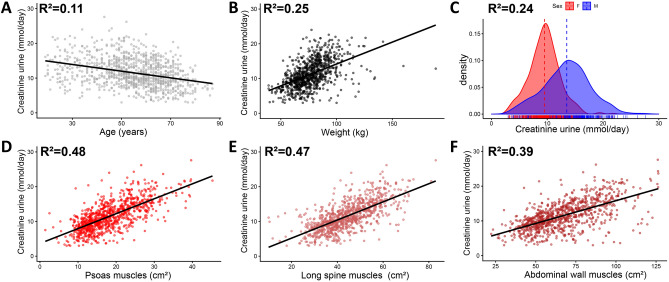
Figure 2.
Plots comparing muscle surface areas and clinical parameters with urinary creatinine excretion. (A–C) Association with clinical characteristics age (A), weight (B), and Sex (C). (D–F) Association between muscle surface areas (segmented > − 15HU) from the psoas muscles (D), long spine muscles (E), and abdominal wall muscles (F). Solid regression lines in dot plots are calculated with ordinary least squares regression. The probability density was calculated with kernel density estimation and shows excretion in the female (F, red colour) and male sex (M, blue colour). The dashed line represents the mean of the different groups. The R2-values were calculated with ordinary least squares regression.

