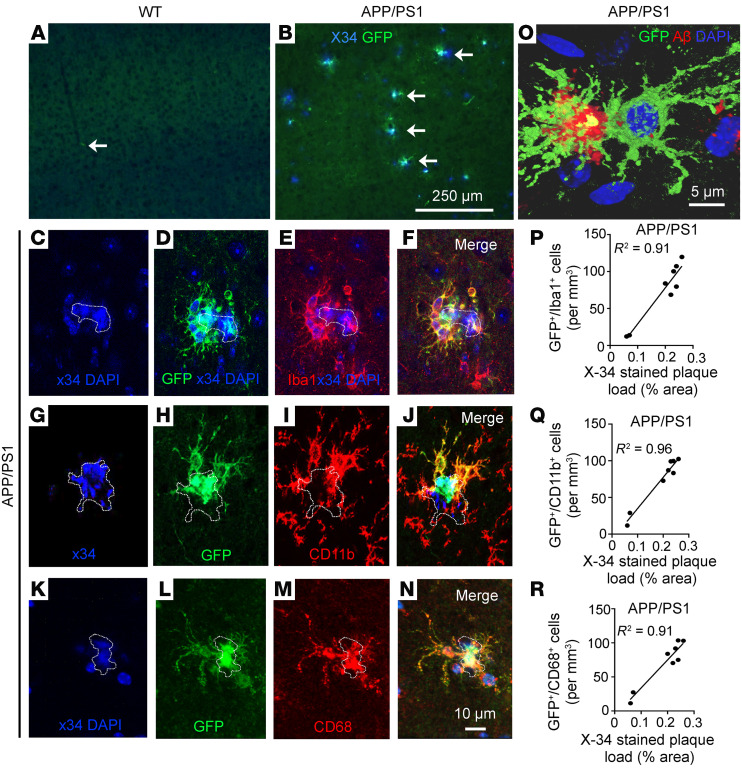
Figure 3. Fate mapping demonstrates peripheral monocyte–derived cells adjacent to amyloid plaques in the brain parenchyma of APP/PS1 mice.
(A and B) Representative cortical sections from aged WTmTmG;Flt3-Cre (n = 5) and APP/PS1mTmG;Flt3-Cre mice (n = 8) demonstrating that GFP+ cells (A) are not detected in the WT brain parenchyma and (B) are seen adjacent to X-34–stained amyloid plaques in APP/PS1 mice. White arrows point to a GFP+ cell in the perivascular space in WTmTmG;Flt3-Cre brain in A and to GFP+ cells adjacent to X34-labeled amyloid plaques in B. Scale bar: 250 μm. (C–N) Representative cortical sections from aged APP/PS1mTmG;Flt3-Cre mice demonstrating X-34–stained plaque (with DAPI-stained nuclei as shown in C, G, and K; plaque is outlined) (D, H, and L) with GFP expression, (E and F) which colocalizes with a microglial marker, Iba-1; (I and J) with CD11b, a marker for activated microglia; and (M and N) with CD68, a marker for phagocytic cells also present on microglia. Scale bar: 10 μm. Dotted lines outline amyloid plaques. (O) A GFP+ cell adjacent to amyloid plaque demonstrating colocalization with Aβ (red). Dotted lines outline amyloid plaques. Scale bar: 5 μm. (P–R) Correlation between the density of GFP+ cells expressing (P) Iba-1, (Q) CD11b, and (R) CD68 in the cortex and the amyloid plaque load detected by X-34 staining. Pearson’s coefficient of correlation, R2 is shown with P < 0.001.

