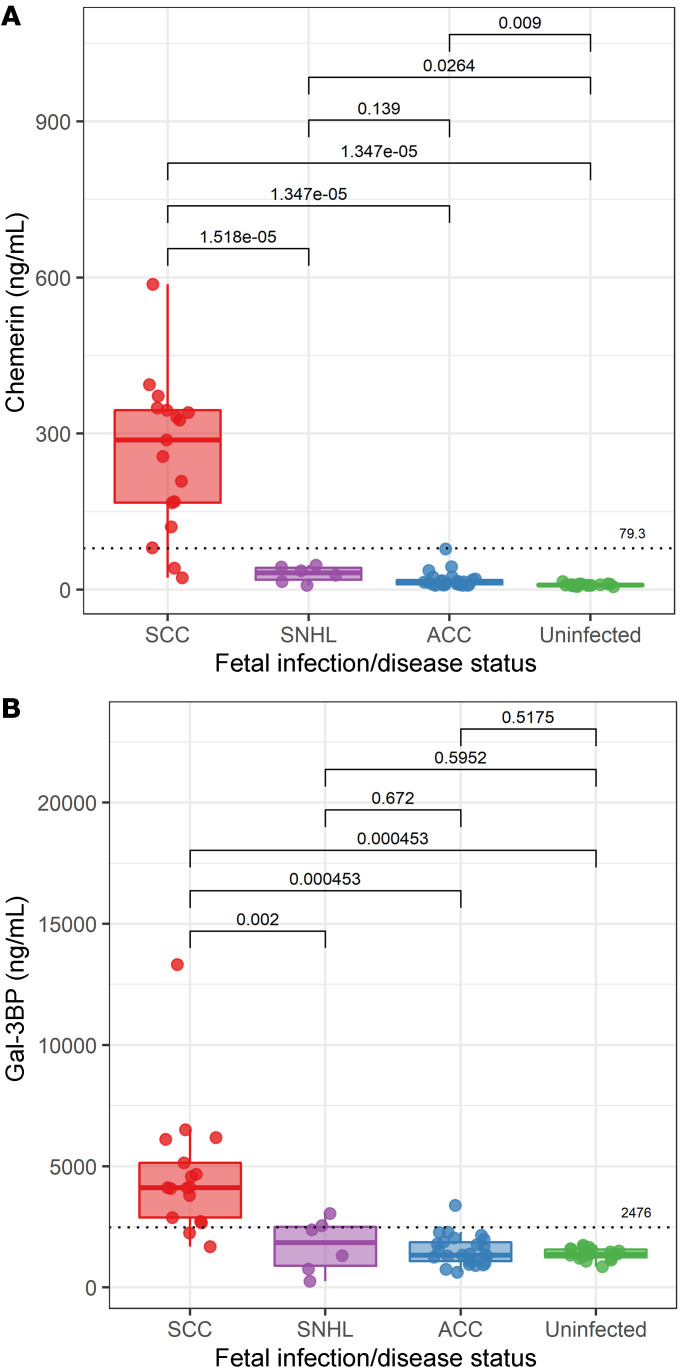
Figure 4. Amniotic fluid chemerin and Gal-3BP levels in fetuses with severe cCMV, SNHL, or asymptomatic cCMV, and in uninfected fetuses.
The levels shown were analyzed in an independent validation cohort of 17 fetuses with severe cCMV, 26 fetuses with asymptomatic cCMV, and 19 control uninfected fetuses, as well as in 6 neonates with isolated SNHL. Chemerin (A) and Gal-3BP (B) levels in amniotic fluid according to infection/disease status. In the plots, the dotted horizontal lines represent optimal predictive cutoff values between severe cCMV and asymptomatic cCMV, derived by ROC analysis. The figures were generated using the R ggplot2 package (version 3.1.0). Box plots were generated using geom_boxplot default parameters, such that the box represents the 25th–75th percentiles and the whiskers from the box to the largest or smallest value are no more than 1.5 times the IQR from the box (the IQR is the distance between the first and third quartiles). P values were calculated by Bonferroni’s correction for multiple comparisons.

