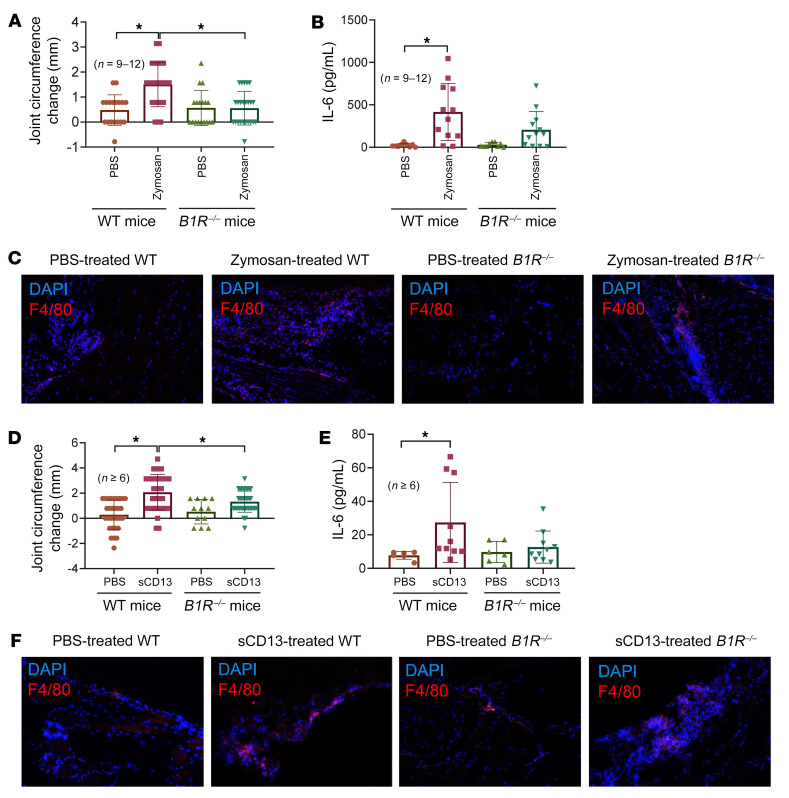
Figure 7. B1R–/– mice are resistant to zymosan- or sCD13-induced arthritis.
(A) WT mice showed a significant increase in knee swelling 48 hours after ZIA induction, whereas this effect was absent in B1R–/– mice. n = number of mouse knees per group: WT-PBS, n = 18; WT-zymosan, n = 24; B1R–/–-WT, n = 18; B1R–/–-zymosan, n = 24. (B) Increase in IL-6 levels in knee homogenates in WT mice but not in B1R–/– mice after arthritis induction was observed. n = number of mouse knees per group: WT-PBS, n = 9; WT-zymosan, n = 12; B1R–/–-WT, n = 9; B1R–/–-zymosan, n = 12. (C) Zymosan-treated WT mouse cryosections showed a marked increase in F4/80 staining compared with sections from zymosan-treated B1R–/– mice. (D) WT mice showed a significant increase in knee swelling 48 hours after sCD13 injection, whereas this effect was absent in B1R–/– mice. n = number of mouse knees per group: WT-PBS, n = 30; WT-sCD13, n = 36; B1R–/–-PBS, n = 12; B1R–/–-sCD13, n = 38. (E) A significant increase in IL-6 in sCD13-treated joints in WT was observed compared with B1R–/– mice. n = number of mouse knees per group: WT-PBS, n = 6; WT-sCD13, n = 10; B1R–/–-PBS, n = 6; B1R–/–-sCD13, n = 10. (F) sCD13-treated WT mouse cryosections showed a marked increase in F4/80 staining compared with sections from sCD13-treated B1R–/– mice. Red staining represents F4/80 for MNs/macrophages, while blue (DAPI) stains nucleus. Results are expressed as mean ± SD. n = number of mice. Significance was determined by Kruskal-Wallis test (A, B, and E) and 1-way ANOVA (D). Original magnification, ×200.

