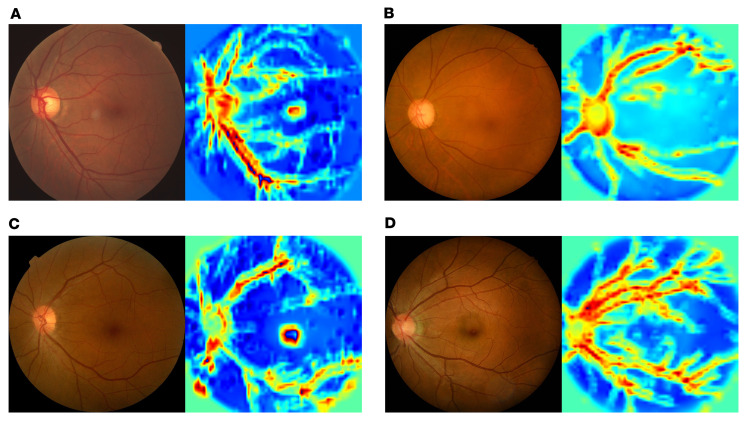
Figure 4. Saliency maps of the deep-learning models.
Visual explanation of the key regions the models used for diagnostic predictions. (A and B) The heatmaps of the typical samples of eyes with (A) and without (B) glaucoma development. (C and D) The heatmaps of the typical samples of eyes with (C) and without (D) glaucoma progression. In both tasks, the saliency maps suggest that the AI model focused on the optic disc rim and areas along the superior and inferior vascular arcades, which are consistent with the clinical approach whereby nerve fiber loss at the superior or inferior disc rim provides key diagnostic clues. AI-based predictions also appear to involve the retinal arterioles and venules.

