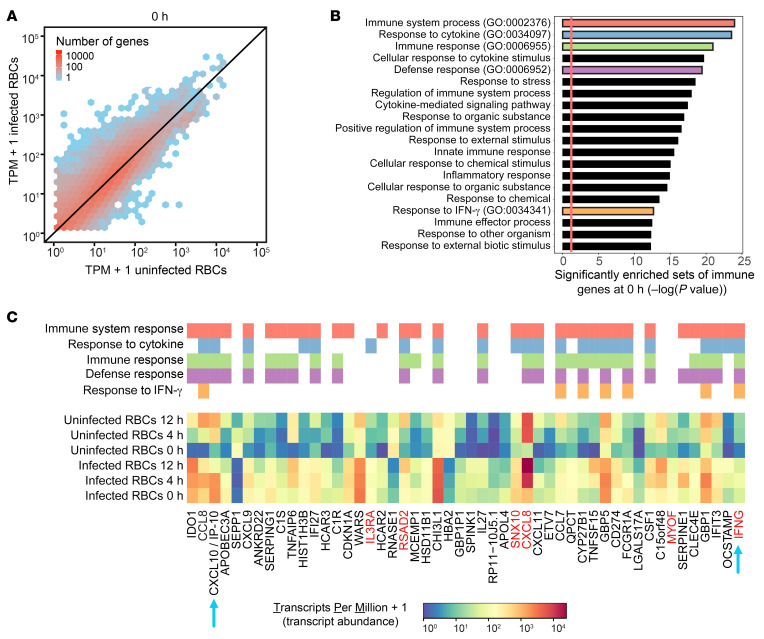
Figure 2. Recent exposure of PBMCs to P. falciparum leads to a sustained immune response that is further amplified by PAM3CSK4.
(A) RNA expression of PBMCs recently exposed to infected and uninfected RBCs and subsequently stimulated with PAM3CSK4 (after 0 hours). RNA expression units correspond to transcripts per million (TPM) mapped reads. Each hexagonal bin shows the number of genes with the corresponding expression level. n = 3. (B) Significantly enriched GO terms (biological processes) among the 100 genes with the greatest fold change between PBMCs recently exposed to infected RBCs and PBMCs exposed to uninfected RBCs at 0 hours prior to PAM3CSK4 stimulation. Five GO terms of interest (red, blue, green, purple, and orange) were further examined in C. (C) Expression levels (TPM) among the 50 genes with the greatest fold change between PBMCs recently exposed to infected RBCs and PBMCs exposed to uninfected RBCs at 0 hours prior to PAM3CSK4 stimulation. Expression levels at 4 and 12 hours after PAM3CSK4 stimulation are also shown. Genes belonging to the 5 GO terms of interest (red, blue, green, purple, and orange) are indicated above the heatmap. The blue arrows indicate genes that are described in the main text. The red gene labels indicate genes that are shown in a subsequent ATAC-Seq experiment.

