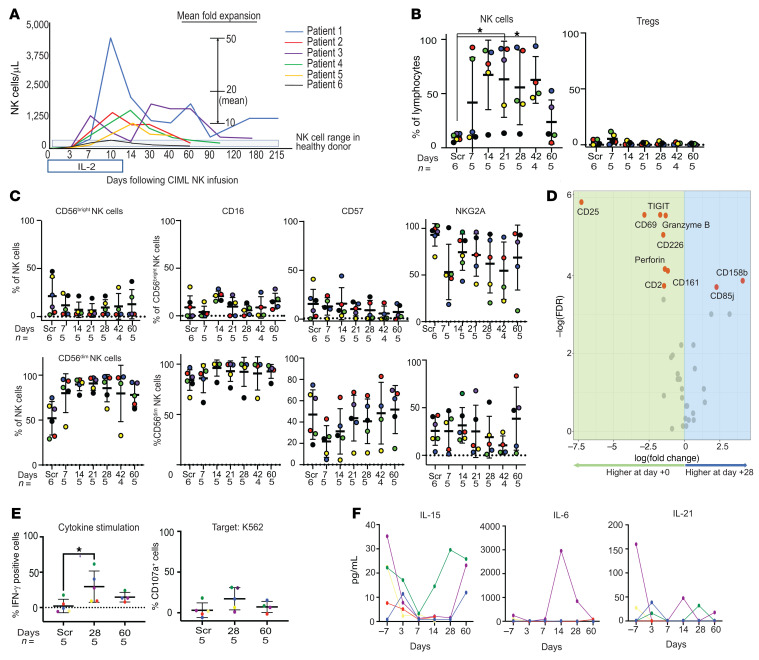
Figure 2. Rapid expansion of NK cells follows infusion of CIML NK product into the patients.
(A) Mean NK cell counts/μL of peripheral blood determined from the lymphocyte count. (B) Flow cytometry was used to evaluate NK cells in the peripheral blood as a proportion of total lymphocytes. Data presented are CD56+CD3– cells as a percentage of total lymphocytes, mean ± SD. Right: Tregs (CD3+CD4+CD25+CD127–) cells as a percentage of total lymphocytes, mean ± SD. The value for each patient is shown with a colored dot, and the coloring scheme corresponds to that in panel A. *P < 0.05 by Mann-Whitney U test, with significance adjusted by Holm’s method for multiple comparisons. (C) Flow cytometry–based evaluation of key markers distinguishing the CD56dim NK cell population from the CD56bright NK cell population. There was no significant difference in expression of markers between time points as determined by the Mann-Whitney U test. (D) Differential expression analysis of mass cytometry markers in the predominant CD56dim clusters between day 0 (infusion product) and day +28 after infusion. Markers labeled in red are differentially expressed (Wilcoxon’s signed-rank test, P < 0.05). (E) Functional characterization of the expanded NK cell compartment using both cytokine stimulation and coculture with K562 target cells at an E:T ratio of 5:1. The y axis shows percentage expression of the indicated marker relative to the corresponding unstimulated control, and the dashed line represents the same functional assays applied to healthy donor control PBMCs. In B, C, and E, the screening time point (Scr) refers to endogenous patient NK cells prior to infusion. *P < 0.05 by Mann-Whitney U test. (F) Measurement of plasma cytokines following CIML NK cell infusion. The x axis of each plot shows days relative to CIML NK cell infusion (day 0).

