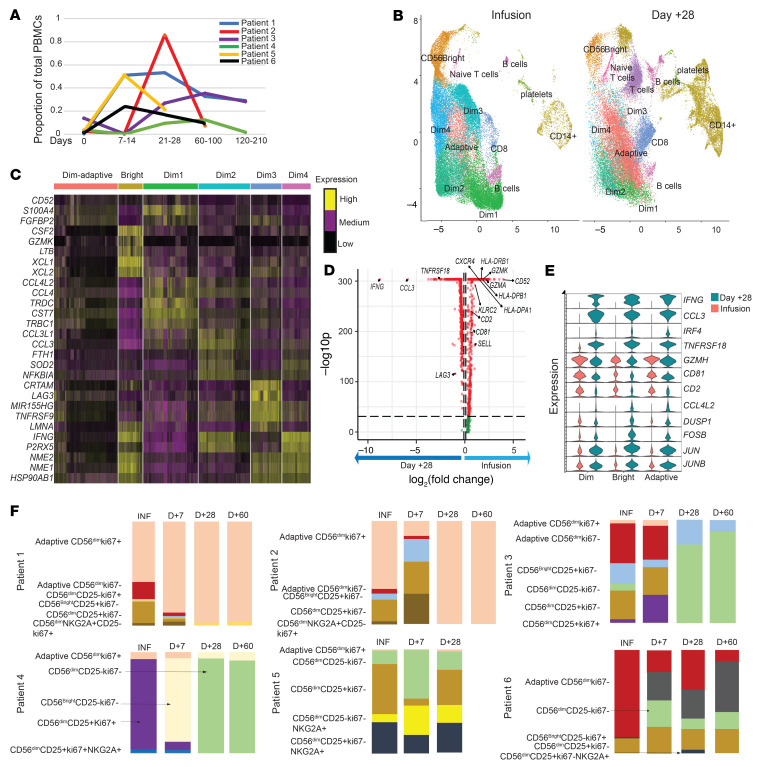
Figure 3. Evaluation of subpopulations of NK cells present in the infusion product over time.
(A) Median proportion of total PBMCs that were CD56+CD3– at the indicated time points. Days after infusion of the CIML NK product are indicated above the time point labels. (B) UMAP of NK cell clusters defined with single-cell RNA sequencing at day +28 compared to the infusion product for all patients whose CIML NK cells expanded. The CD56dim NK cell subpopulations that persist include Dim1, Dim2, CD56bright, and adaptive NK cells. (C) Identification of defined NK cell subpopulations based on transcriptional profiling reveals the expansion of several CD56dim subpopulations and adaptive CD56dim NK cell populations. The heatmap shows the top 5 differentially expressed genes in each NK cell cluster when compared with other clusters using Wilcoxon’s rank-sum test (log[fold change] threshold = 0.25). (D) Volcano plot showing the top differentially expressed genes in all CD56dim clusters between infusion and day +28; fold change cutoff = 0.5, P-value cutoff = 10 × 10–32. Differential gene expression was determined using the nonparametric Wilcoxon’s rank-sum test. (E) Violin plot to show the expression of select genes within the CD56dim, CD56bright, and adaptive CD56dim NK populations at infusion (red) and day +28 (green) time points. Shown are the most differentially expressed markers as well as genes associated with NK cell activation. (F) Evaluation of NK cell subpopulations over time as a proportion of total NK cells in each of the clinical trial patients treated with CIML NK cell therapy. Key subpopulations include adaptive NK cells (CD56+CD3–CD57+KIR+NKG2C+FcεRI–), CD56bright NK cells (CD56hiCD3–NKG2A+IL-7R+), CD56dimNKG2A+ NK cells, and CD56dimKi67+ NK cells, among others. The sample time points for each patient are labeled. INF, at time of infusion.

