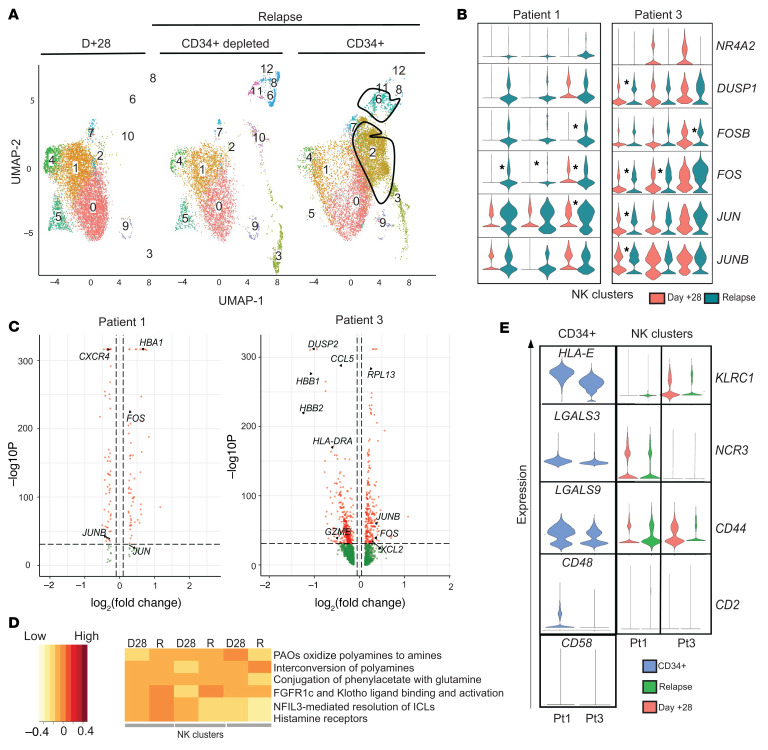
Figure 8. Transcriptomic evaluation of NK cells and AML blasts at the time of disease relapse by scRNA-seq.
(A) Representative UMAP from scRNA-seq analysis in patient 1. The outlined populations are CD34+ blasts that were identified at relapse. (B) Violin plots corresponding to the expression of activation markers in CD3–CD56+ NK cell clusters defined using scRNA-seq. *P < 0.05 by Wilcoxon’s rank-sum test, with significance adjusted for multiple comparisons (50). (C) Volcano plots for patient 1 (left) and patient 3 (right) comparing gene expression in NK cell–containing scRNA-seq clusters at day +28 to relapse. Genes on the left of the violin plot are downregulated while those on the right are upregulated at the time of relapse. (D) Gene set enrichment analysis corresponding to differentially expressed genes in NK cell clusters derived from scRNA-seq data in patient 1 as a representative example. Within every cluster, every pair of columns corresponds to day +28 (D28) and relapse (R) time points. The intensity of expression is represented by the color of the legend on the left. (E) Expression of specific NK cell receptors within the NK clusters on day +28 and relapse in patient 1 (P1) and patient 3 (P3) and their corresponding NK ligands on the relapsed leukemia blasts are indicated in blue (CD34+ cells).

