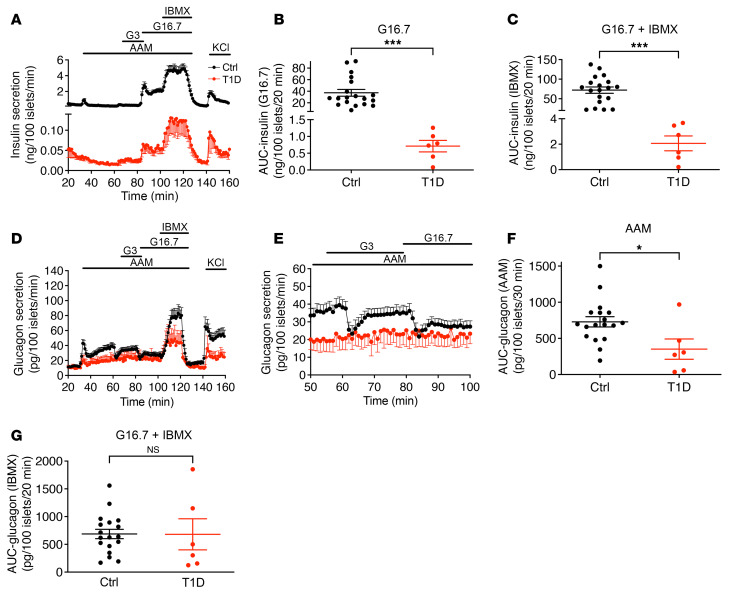
Figure 2. Insulin and glucagon secretion in islets from healthy and T1D donors.
(A) The dynamics of insulin secretion in response to different stimuli. (B) Total insulin secretion during 16 mM glucose stimulation. (C) Total insulin secretion during IBMX potentiation. The basal and maximal insulin secretion in T1D islets was 1/60 that of normal islets. Notably, T1D islets had similar insulin response patterns at low glucose, high glucose, and with IBMX treatment compared with control islets. (D) Glucagon secretion profiles. (E) Magnified view of a selected section (53–100 min) of the experiment presented in D to highlight the difference in glucose suppression of glucagon secretion between normal and T1D islets. (F) Total glucagon secretion during AAM stimulation. (G) Total glucagon secretion during IBMX potentiation. *P < 0.05 and ***P < 0.001. Ctrl, control.

