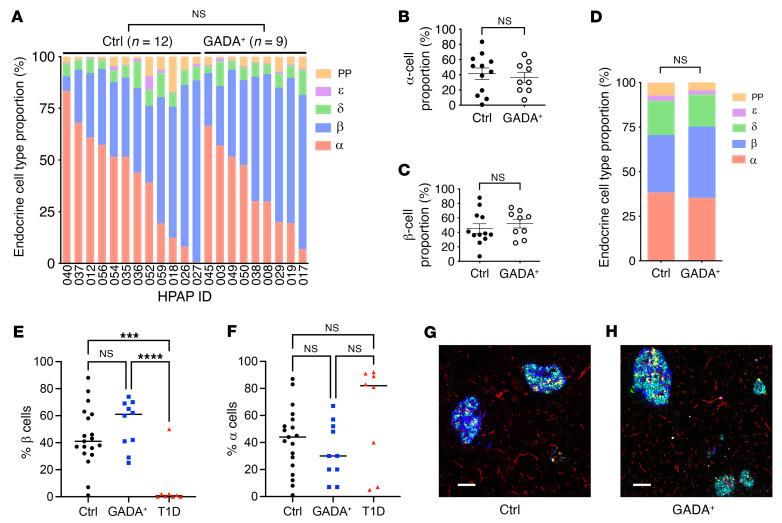
Figure 4. Composition of control and GADA+ donor islets.
(A–C) Endocrine cell type proportions were determined by flow CyTOF of single-cell suspensions of islets. (A) Cell type fraction plotted for the indicated HPAP cases. (B and C) Average α (B) and β (C) cell percentage as determined by flow CyTOF. (D) Endocrine cell type proportions determined by IMC. (E) β Cell percentage of endocrine cells determined from IMC for islets from controls, GADA+, and T1D individuals. (F) α Cell percentage of endocrine cells determined from IMC for islets from controls, GADA+, and T1D individuals. ***P < 0.001 and ****P < 0.0001, by unpaired two-tailed t test. (G and F) Representative examples of IMC images of control (G) and GADA+ (H) pancreas with 6 channels shown (cyan, insulin-peptide; blue, glucagon; yellow, somatostatin; red, PECAM; magenta, pancreatic polypeptide; green, ghrelin). Scale bars: 100 μm.

