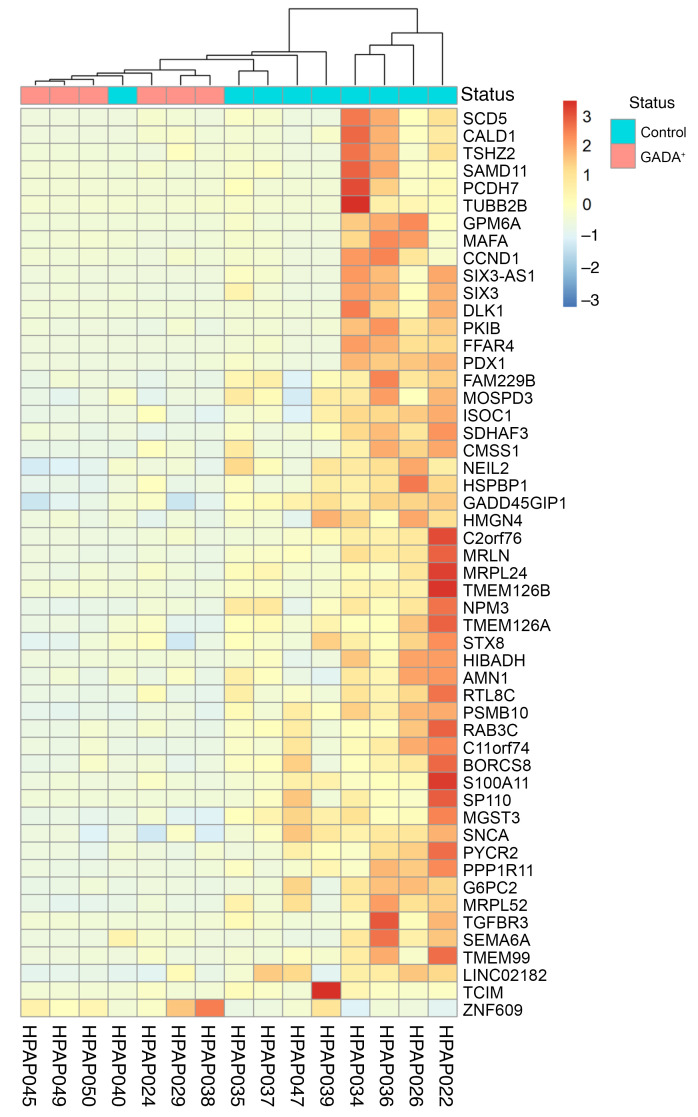
Figure 5. Single-cell transcriptome analysis and immunofluorescence staining of control and GADA+ α cells.
Heatmap of hierarchical clustering of differentially expressed genes obtained by comparing pseudobulk α cell gene expression of 9 control and 6 GADA+ organ donors. This heatmap was generated with the R package heatmap.

