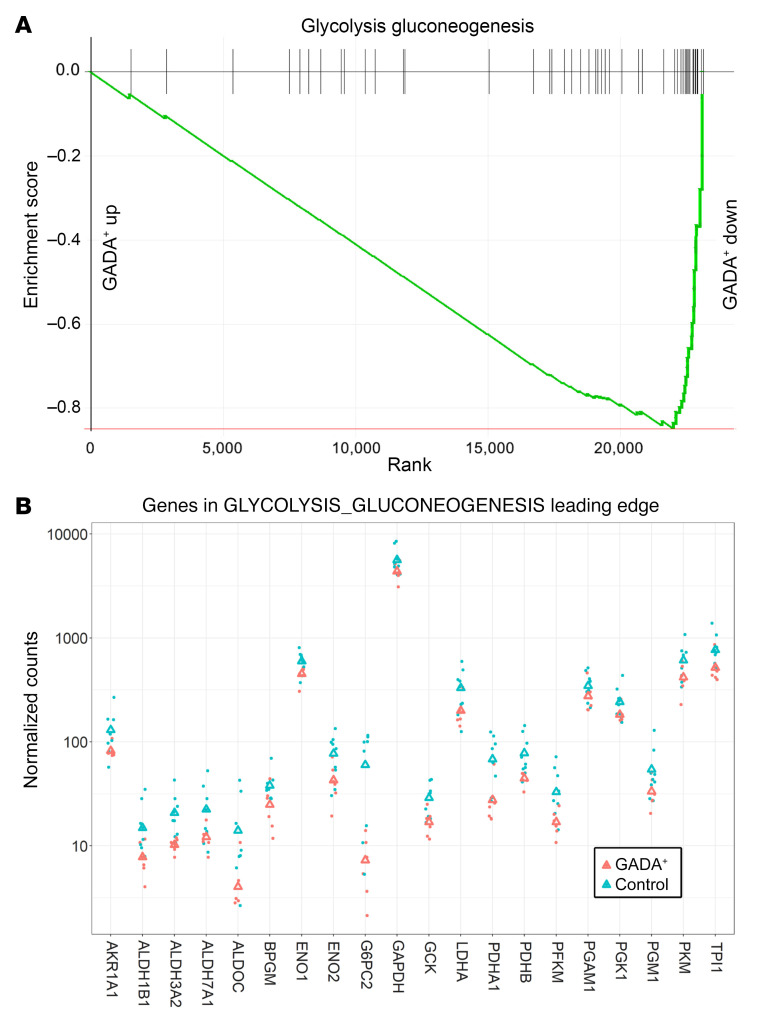
Figure 6. GSEA of glycolysis and gluconeogenesis genes in GADA+ donors compared with controls.
(A) Genes annotated to the “glycolysis_gluconeogenesis” pathway are highly enriched among the genes downregulated in α cells from GADA+ organ donors. up, upregulated; down, downregulated. (B) Expression of the top 15 genes in the leading edge of the “glycolysis_gluconeogensis” pathway. Triangles indicate the mean.

