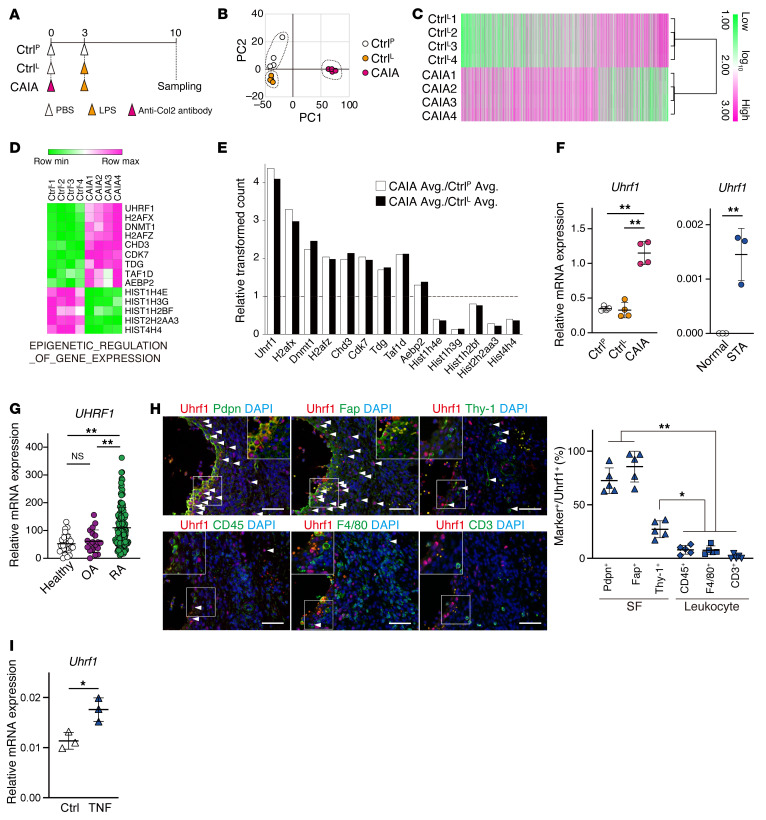
Figure 1. Upregulation of the epigenetic regulator Uhrf1 in arthritis tissue.
(A) Protocol for analysis of collagen antibody-induced arthritis (CAIA) model. PBS (CtrlP) or LPS (CtrlL) was administered as a control. (B) PCA using microarray data obtained from ankle tissue. (C) Heatmap of differentially expressed gene probes in ankle tissue (log2FC > |1|, P < 0.01). Log10 transformed read counts are scaled from 1.0 to 3.0. (D) Expression of genes related to epigenetic regulation classified by GSEA. Log10 transformed read counts are scaled to minimum to maximum values. (E) Relative probe counts detected in CAIA ankle compared with CtrlP or CtrlL ankles. (F) RT-qPCR of Uhrf1 mRNA expression in CAIA (n = 4) and STA (n = 3) ankles. (G) UHRF1 mRNA expression in synovium biopsies from healthy individuals, patients with OA, and patients with RA by RNA-Seq. Data are registered in the Gene Expression Omnibus (GEO GSE89408). (H) Left, representative images of immunofluorescence staining for Uhrf1 (red); Pdpn, Fap, Thy-1, CD45, F4/80, and CD3 (green); and DAPI (blue) in WT STA ankle tissue. Scale bar: 50 μm. Right, quantification of Uhrf1+ marker cells in hyperplastic synovium. Cell number in 1 field per similar region of independent mice was calculated. (I) Uhrf1 mRNA expression in SFs treated with 20 ng/mL Tnf-α for 24 hours. Mean ± SD is shown. *P < 0.05 and **P < 0.01 by ANOVA followed by Tukey’s test in F (left), G, and H, and unpaired t test in F (right) and I. Data in A–F and H–I were obtained from 3 to 5 independent experiments.

