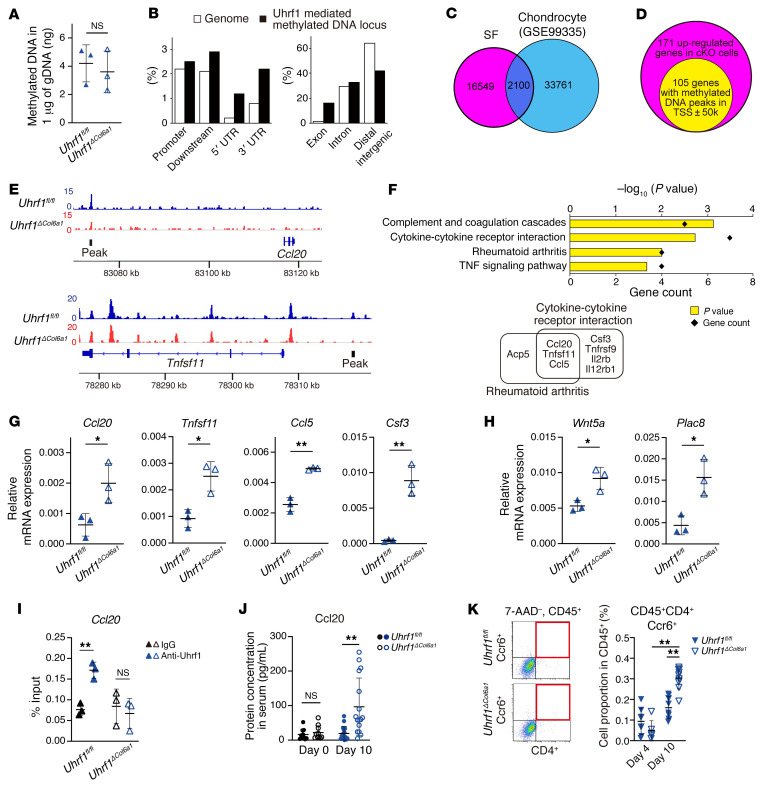
Figure 5. Uhrf1 suppresses expression of multiple genes involved in RA via modulation of DNA methylation.
(A) Quantification of methylated DNA after enrichment from genome DNA using MBD beads. (B) Distribution of Uhrf1-mediated methylated DNA annotated using given intervals and scores with genome features by CEAS. (C) Venn diagram to compare Uhrf1-mediated methylated DNA loci between SFs and chondrocytes using MBD-Seq data from this study and GEO GSE99335. (D) Venn diagram for 171 genes having upregulated expression in Uhrf1ΔCol6a1 SFs and 105 genes having Uhrf1-mediated methylated DNA peaks within the transcriptional start site region (± 50 kb). (E) Representative Uhrf1-mediated methylated DNA peaks visualized by Integrative Genomics Viewer. (F) KEGG pathway analysis of 105 upregulated with peaks assigned using DAVID Bioinformatics Resources. Significantly enriched pathways illustrated by gene counts and P values. Representative mRNA expression of genes included in the (G) KEGG pathways “Rheumatoid arthritis” and “Cytokine-cytokine receptor interaction” and (H) GO biological process “Negative regulation of apoptotic process” in SFs from Uhrf1fl/fl and Uhrf1ΔCol6a1 mice (n = 3) as measured by RT-qPCR. (I) ChIP-qPCR assay of Uhrf1 for Ccl20 locus in Uhrf1ΔCol6a1 and Uhrf1fl/fl SFs. (J) Quantification of Ccl20 serum levels in Uhrf1fl/fl and Uhrf1ΔCol6a1 on day 0 (n = 10) and day 10 (n = 16) after STA induction. (K) Left, flow cytometry analysis of the population of Th17 cells (CD45+, CD4+, Ccr6+) in Uhrf1fl/fl and Uhrf1ΔCol6a1 derived from STA mice on day 4 (n = 6–8) and day 10 (n = 9–10). Right, quantification of CD45+CD4+Ccr6+ cells among CD45+ cells. Mean ± SD shown. NS, not significant versus Uhrf1fl/fl. *P < 0.05 and **P < 0.01 by unpaired t test in G–J and ANOVA followed by Tukey’s test in K. Data in A, G, and H obtained from 3 independent experiments. Data in B–F obtained from combined read data from 3 independent experiments. Data in I were technically replicated 3 times. Data in J and K obtained from 6–10 independent experiments.

