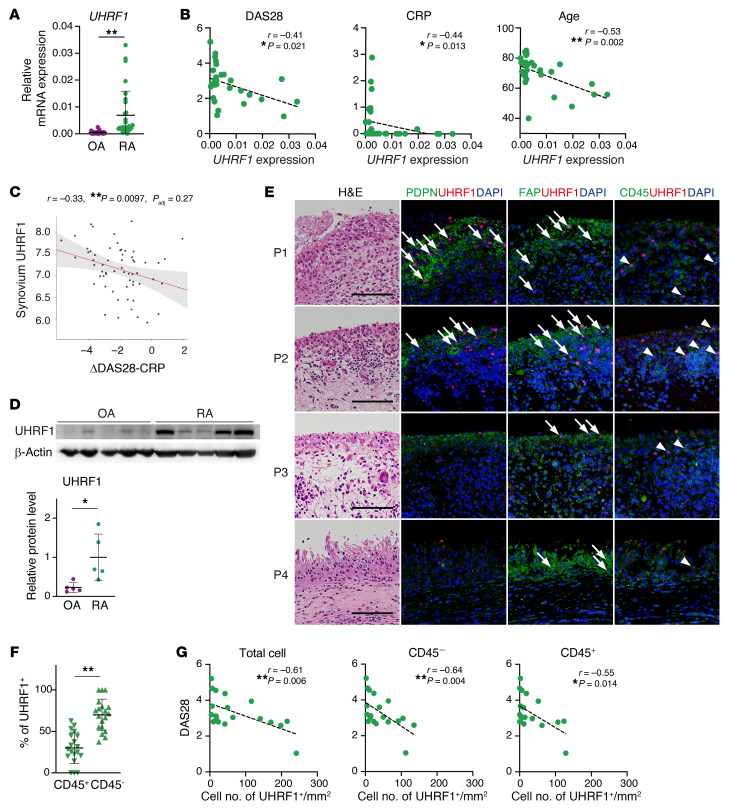
Figure 6. UHRF1 expression is negatively correlated with several RA pathogeneses.
(A) Expression levels of UHRF1 and DNMTs (DNMT1, DNMT3A, and DNMT3B) mRNA in synovium obtained from patients with OA (n = 32) and RA (n = 30). (B) Spearman’s correlation between UHRF1 mRNA expression in RA synovium (n = 30) and disease activity score 28-CRP (DAS28) as well as levels of C-reactive protein (CRP) and age. (C) Correlation of UHRF1 expression in RA synovium with 6-month response to DMARD treatment measured by ΔDAS28-CRP (https://peac.hpc.qmul.ac.uk/). (D) Top, Western blot analysis of OA synovium (n = 5) and RA synovium (n = 5). Bottom, quantification of relative UHRF1 protein levels. (E) H&E staining and immunofluorescence staining for UHRF1 (red); PDPN, FAP, CD45 (green); and DAPI (blue) in specimens from multiple patients with RA (P1–P4). Scale bar: 100 μm. Arrow and arrowhead indicate UHRF1+ cells in cells positive for SF markers PDPN and FAP and leukocyte marker CD45, respectively. (F) Quantification of UHRF1+ cell number in CD45+ cells and CD45– cells among total UHRF1+ cells (n = 19). (G) Spearman’s correlation between DAS28 and number of UHRF1+ cells per tissue area (n = 19). Mean ± SD is shown. *P < 0.05 and **P < 0.01 by Mann-Whitney U test in A and D, and by Wilcoxon signed-rank test in F. All data were obtained from 5–32 independent experiments.

