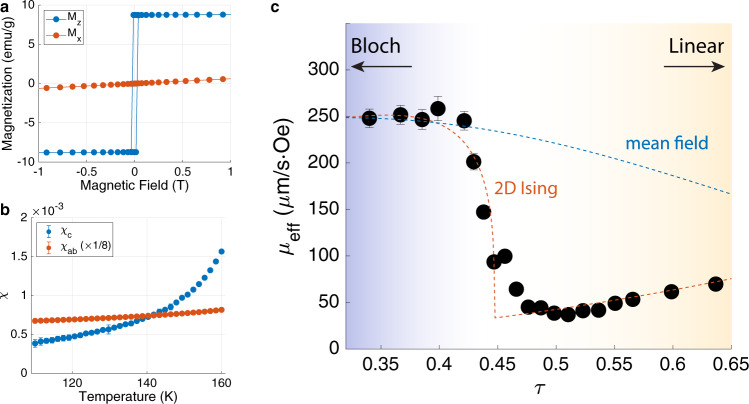
Fig. 4. Magnetic susceptibility and 2D Ising transition.
a Magnetization versus magnetic field along out-of-plane (z) and in-plane (x) directions, respectively. b Magnetic susceptibility plotted against temperature. The in-plane susceptibility data divided by 8 for clarity. c Effective mobility, , of the DW is plotted against , which is the control parameter for the linear wall phase transition. The data fits is consistent with the DW mobility predicted by the 2D Ising model (red dotted line)24, but not with the mean-field theory (blue dotted line), which predict a phase transition at . Error bars represent the uncertainties of least square fitting of data.

