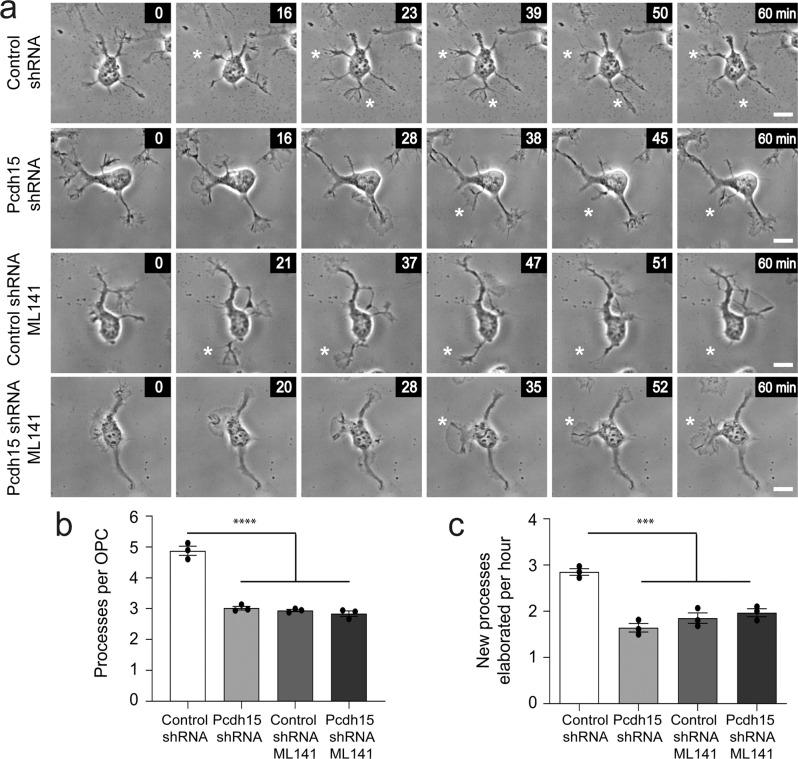
Fig. 10. Inhibiting Cdc42 activity phenocopies the effect of Pcdh15 knockdown on OPC process number and generation.
a Image series extracted from time-lapse videos to show individual control and Pcdh15 knockdown OPCs treated with DMSO or ML141 (10 µM), as they elaborate new processes over time. All images are time-stamped relative to the first image in the depicted series (designated as 0 min). White asterisks indicate the new process. b The mean number of processes supported by control and Pcdh15 knockdown OPCs treated with DMSO or ML141 [mean ± SEM, n = 3 independent cultures, ≥76 OPCs analysed per condition; one-way ANOVA: F (3,8) = 108.4, ****p < 0.0001]. c The mean number of new processes that OPCs elaborated per hour in control and Pcdh15 knockdown cultures treated with DMSO or ML141 [mean ± SEM, n = 3 independent cultures and n ≥ 34 cells analysed per culture condition; two‐way ANOVA: shRNA treatment F (1,8) = 13.37, p = 0.0064; drug treatment F (1,8) = 35.06, p = 0.0004; interaction F (1,8) = 51.65, p < 0.0001 with Bonferroni multiple comparisons, ***p < 0.001]. Scale bars represent 10 µm.

