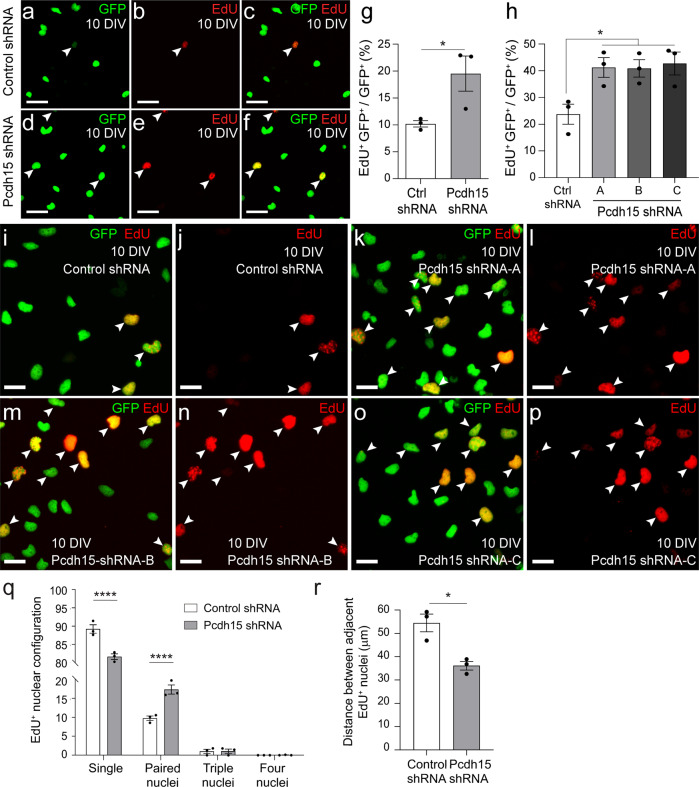
Fig. 3. Pcdh15 knockdown increases OPC proliferation in vitro.
a–f Confocal images showing control (a–c) or Pcdh15 knockdown (d–f) GFP+ OPCs (green) after 12 h of EdU labelling (red). White arrowheads indicate EdU+ GFP+ OPCs. g The proportion of control and Pcdh15 knockdown GFP+ OPCs (%) that incorporated EdU (EdU+ GFP+/GFP+ × 100; mean ± SEM, n = 3 independent cultures; unpaired t-test, *p = 0.048). h The proportion (%) of GFP+ OPCs that incorporate EdU (EdU+ GFP+/GFP+ × 100) in cultures transfected with control-shRNA, Pcdh15-shRNA-A, Pcdh15-shRNA-B or Pcdh15-shRNA-C [mean ± SEM, n = 3 independent cultures; one‐way ANOVA: F (3,8) = 5.658, p = 0.02; Tukey’s multiple comparisons test: Control shRNA vs Pch15 shRNA-A, *p < 0.05; Pcdh15-shRNA-A vs. Pcdh15-shRNA-B, p = 1.0; Pcdh15-shRNA-A vs. Pcdh15-shRNA-C, p = 1.0, Pcdh15-shRNA-B vs. Pcdh15-shRNA-C, p = 0.99]. i–p Confocal images showing EdU-labelling (red) in GFP+ OPCs (green) transfected with control-shRNA (i, j), Pcdh15-shRNA-A (k, l), Pcdh15-shRNA-B (m, n) or Pcdh15-shRNA-C (o, p). q The proportion (%) of EdU+ GFP+ nuclei that belonged to: single cells (nuclei not contacting others); paired cells (two nuclei in contact), or clustered cells (groups of three or four nuclei in contact with each other) [mean ± SEM for n = 3 independent cultures; ≥86 EdU+ GFP+ cells analysed per coverslip. Two-way ANOVA: shRNA F (1, 16) = 0.0037, p = 0.9524; cluster F (3, 16) = 6206, p < 0.0001; interaction F (3, 16) = 35.79, p < 0.0001; with Bonferroni multiple comparison test: ****p < 0.0001. r Quantification of the mean Euclidean distance between EdU+ GFP+ nuclei (mean ± SEM, n = 3 independent cultures; ≥86 EdU+ GFP+ cells analysed per coverslip, unpaired t-test with welch’s correction, *p = 0.024). Scale bars represent 25 µm (a–f) or 15 µm (i–l).

