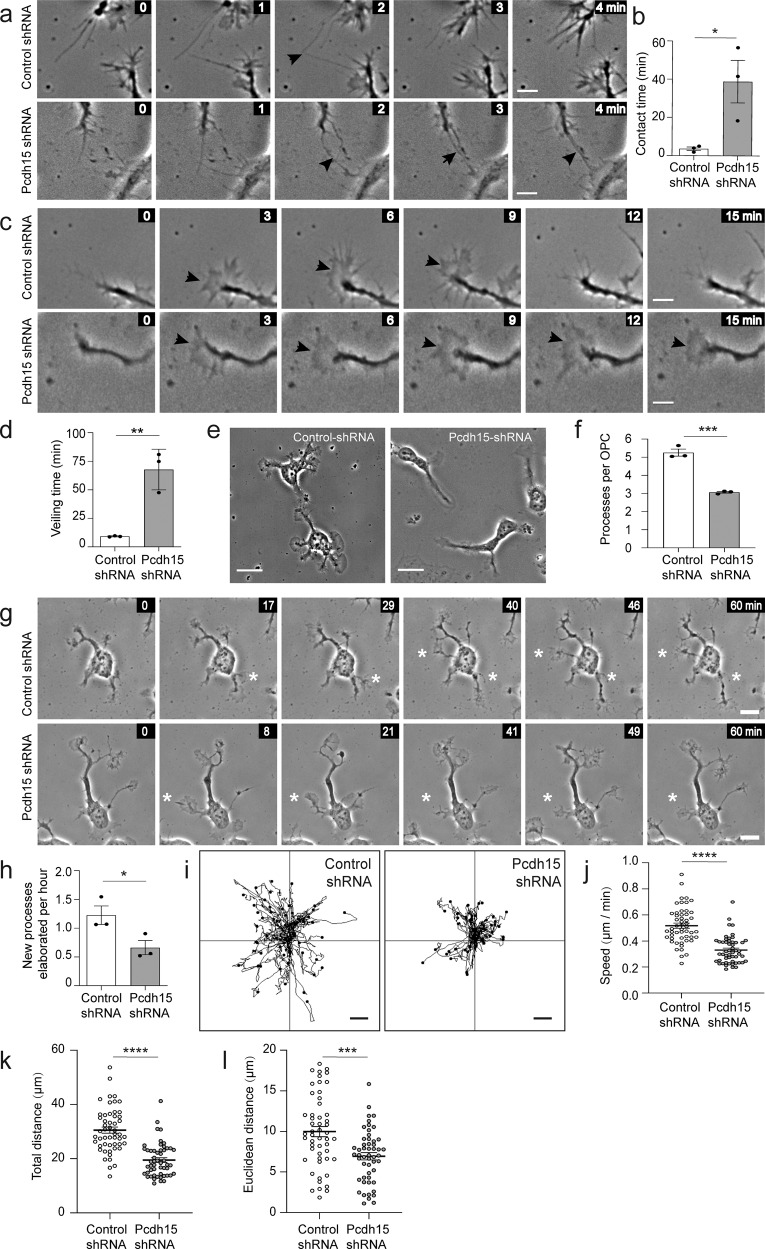
Fig. 5. Pcdh15 promotes OPC motility and filopodial repulsion in vitro.
12 h after OPCs were transfected with control or Pcdh15-shRNA, they were imaged once a minute for 2 h and the resulting time-lapse videos were used to quantify different aspects of OPC motility. a Image series show a filopodial contact (black arrowhead) between adjacent OPCs in a control and Pcdh15 knockdown culture. All images are time-stamped relative to the first image in the depicted series (designated as 0 min). b The mean duration (min) that a filopodial contact was sustained in control and Pcdh15 knockdown cultures (mean ± SEM, n = 3 independent cultures, ≥66 filopodial contacts measured per condition; unpaired t test, *p = 0.034). c Excepts from a time-lapse image series showing a control OPC process as it extrudes and retracts a veil and a Pcdh15 knockdown OPC as it extrudes and maintains its veil. The images are time-stamped relative to the first image in the depicted series (designated as 0 min). Black arrowheads indicate elaborated veils. d Quantification of the mean veiling time for OPC processes in control- and Pcdh15-shRNA treated cultures (time taken to complete an extrusion and retraction) (mean ± SEM, n = 3 independent cultures, ≥146 veils analysed per condition; unpaired t-test, **p = 0.004). e Images of control- and Pcdh15-shRNA treated OPCs, 12 h after transfection. f Quantification of the mean number of processes supported by control and Pcdh15 shRNA-treated OPCs (mean ± SEM, n = 3 independent cultures and ≥81 OPCs analysed per condition; unpaired t test, ***p = 0.0004). g Short image series extracted from the time-lapse videos to show control and Pcdh15 knockdown OPCs extending a new process. All images are time-stamped relative to the first image in the depicted series (designated as 0 min) and the white asterisks denote the new processes. h Quantification of the mean number of new processes elaborated by control- and Pcdh15-shRNA transfected OPCs each hour (mean ± SEM, n = 3 independent cultures and ≥35 OPCs analysed per condition; unpaired t test, *p = 0.048). i The migration trajectories for the soma of 52 control- or Pcdh15-shRNA treated OPCs. j Mean migration speed for the soma of control- and Pcdh15-shRNA treated OPCs (mean ± SEM, n = 52 OPCs per group, unpaired t tests with Welch’s correction, ****p < 0.0001). k Mean distance that each OPC soma moved (path length) in control- and Pcdh15-shRNA treated cultures (mean ± SEM, n = 52 OPCs per group, unpaired t tests with Welch’s correction, ****p < 0.0001). l Mean Euclidean distance (shortest distance between the start and end points) that each OPC soma moved in control- or Pcdh15-shRNA treated cultures (mean ± SEM, unpaired t tests with Welch’s correction, ***p < 0.0002). Scale bars represent 5 µm (a, c), 8 µm (g) or 20 µm (e).

